
In this article, we will see how to combine different dimensions and facts inside a single matrix table visual.
This approach helps us create fewer measures and tables, but at the same time, it provides us with greater design possibilities, like conditional formatting across the whole column even though there are different measures invoked inside the column. The previous would be impossible without this technique.

We would want to consider this approach when we need to:
- Create matrix with multiple, time-dependent measures,
- Have a conditional formatting across multiple measures,
- Show different dimensions in the same matrix, with more design options.
This technique should save you hours of work and remove redundant multiple matrices.
If you wish to follow along, you can download the pbix. file here. The data model we use for this purpose is a simple one, consisting of 3 dimensions and one fact table. Model is based on Sales and Marketing sample database from Microsoft.

Multiple facts in one Matrix Concept
There are 3 main ingredients we need to use to produce a proper Matrix table with multiple facts and dimensions.
- Helper table,
- Combination Measure,
- Final measures for date context manipulation.
Now let’s step through each one of them.
HELPER TABLE
Helper table will be used for plotting row labels and for filtering a combination measure through calculation. This way, for each row in the matrix table visual, a combination measure will return the value associated with the row label of the visual.
Helper table consists of 4 columns. 2 of them are used for filtering part, and 2 for sorting the Matrix Visual.
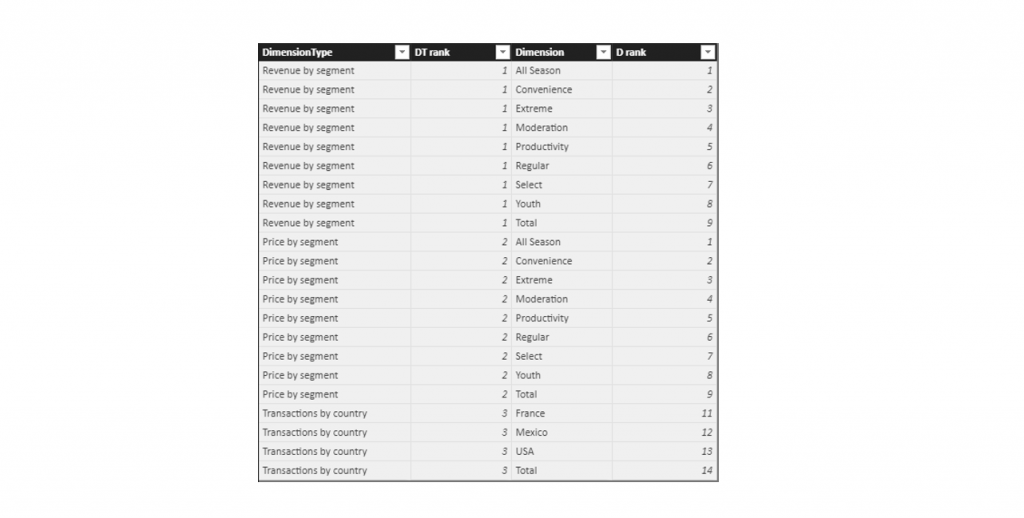
- DimensionType – Label stating which fact will be used across which dimension,
- DT rank – Order by which the DimensionTypes will be shown in the Matrix.
- Dimension – Here we need to specify all available distinct values from the dimension columns we wish to plot on the Matrix. If we want to include Total for each dimension, we also need to put it in the Dimension column.
- D rank– Order by which the Dimension will be shown in the Matrix – we need to repeat values for each DimensionType if the dimension is the same. If we have multiple dimension that we wish to plot, then for each additional dimension, we need to provide a larger set of numbers compared to the previous dimension. In the example above we can see that both Revenue by segment and Price by segment are all based on [Segment] column, so they can have the same ordering from 1-9. Transactions by country are based on the [Country] column, so its rank has to have different values associated with each dimension value (11-14).
Segmentation Measure
The most important part of this technique. We will use this measure to combine values from the helper table to provide each row in the matrix visual with the correct calculation considering the visual row label. The formula is as follows:
CombinationMeasure =
IF (
    ISFILTERED ( '1_Table Matrix'[Dimension] ),
    SWITCH (
        VALUES ( '1_Table Matrix'[DimensionType] ),
        "Revenue by segment",
            IF (
                VALUES ( '1_Table Matrix'[Dimension] ) = "Total",
                [Revenue],
                CALCULATE (
                    [Revenue],
                    Dim_product[Segment] = VALUES ( '1_Table Matrix'[Dimension] )
                )
            ),
        "Price by segment",
            IF (
                VALUES ( '1_Table Matrix'[Dimension] ) = "Total",
                [AveragePrice],
                CALCULATE (
                    [AveragePrice],
                    Dim_product[Segment] = VALUES ( '1_Table Matrix'[Dimension] )
                )
            ),
        "Transactions by country",
            IF (
                VALUES ( '1_Table Matrix'[Dimension] ) = "Total",
                [NumberOfTransactions],
                CALCULATE (
                    [NumberOfTransactions],
                    Dim_geo[Country] = VALUES ( '1_Table Matrix'[Dimension] )
                )
            ),
        BLANK ()
    )
)
Although lengthy, the formula is not really a complex one. There are 3 important parts of it:
- ISFILTERED part is checking whether the [Dimension] column from Helper table is filtered. This way we are ensuring that the table would not show any values in the labels of the first grouping level (eq for Revenue by segment label in the matrix visual).
- SWITCH function – selects the right calculation based on the [DimensionType] column from Helper table (outer grouping in the Matrix).
- Formula inside the each of SWITCH arguments – IF function is used to check if the current row in the Matrix visual is “Total”. If it is total, then the IF function simply returns calculation in the current filter context. If the value of the current row in the Matrix visual is other than “Total”, then the formula evaluates calculation with the condition that applies Matrix row value as a filter that filters the fact table in the data model. In this step it is important to provide the right column to the filtering part (eq for Revenue by segment we provided Dim_product[Segment] column, while for Transactions by country, we provided Dim_geo[Country] column.
Final measure for the date context manipulation
With the Combination Measure in place, you can call it under modified filter context. We will modify date context to show “Combination Measure” in different time frames, like YTD, MTD, QTD etc.
The final step is a simple one. Just call the combination measure with the changed date context (example MTD TY).
MTD TY =
VAR lastAvailableDate =
    LASTDATE ( Fact_sales[Date] )
RETURN
    CALCULATE (
        [CombinationMeasure],
        DATESBETWEEN (
            Dim_date[Date],
            DATE ( YEAR ( lastAvailableDate ), MONTH ( lastAvailableDate ), 1 ),
            DATE ( YEAR ( lastAvailableDate ), MONTH ( lastAvailableDate ), DAY ( lastAvailableDate ) )
        )
    )
This way we can have multiple date selections in the single matrix, and even conditional formatting spread across all measures and dimensions. We can use other visuals or slicers to further drill into matrix calculations, like in the example below.
Hope you enjoyed reading through the article and that you will find this technique helpful in future modeling with DAX.
If you have any questions please comment below!
And if you liked the article, don’t forget to like/share!


