
Blog
Redovito pišemo članke i blogove o tehnologijama Microsoft Business Intelligence. Popis u nastavku prikazuje sav naš sadržaj sortiran kronološki - možete filtrirati sadržaj prema temi posta.
Divorces in Slovenia – Stable in Numbers, Shifting in Nature
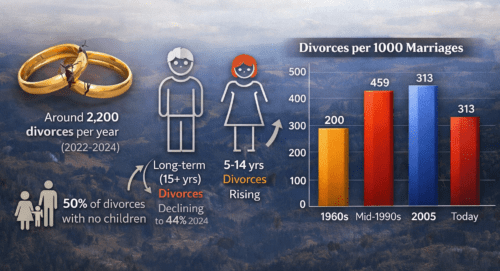
Number of Divorces Data from the Statistical Office of the Republic of Slovenia shows that the number of divorces in Slovenia is declining. In each year from 2022 to 2024, around 2,200 divorces were recorded annually. Excluding the COVID year 2020, divorce numbers were last this low in 2000. Given the parallel decline in marriages,
New!
DAX Handbook, over 30 articles on the basic and intermediate DAX written in a concise and easy-to-understand way!
- ALL
- POWERBI
- DAX
- POWER QUERY
- POWERAPPS
Total Articles: 94
Divorces in Slovenia – Stable in Numbers, Shifting in Nature
Number of Divorces Data from the Statistical Office of the Republic of Slovenia shows that the number of divorces in Slovenia is declining. In each year from 2022 to 2024, around 2,200 divorces were recorded annually. Excluding the COVID year 2020, divorce numbers were last this low in 2000. Given the parallel decline in marriages,
Marriages in Slovenia – Declining and Shifting
The number and rate of marriages in Slovenia, as in the wider region, are in decline. Marriage has shifted from a near-universal early-life milestone to a selective mid-life choice. Marriage Trends According to data from Republic of Slovenia Statistical office covering period from 1988 to 2024, the highest number of marriages was recorded in 1989,
Who Visits Slovenia and When
Which foreign tourists visit Slovenia the most, and when do they come? Experimental data from the Statistical Office of the Republic of Slovenia, based on foreign mobile users roaming on Slovenian networks, offers a detailed view. Top Visitors According to the data, tourists from Austria (13.3%), Germany (13.1%), and the Netherlands (12.3%) account for almost
Where Slovenians Travel and When
Where do Slovenians like to travel, and when do they go? Experimental data from the Statistical Office of the Republic of Slovenia, based on mobile users roaming in foreign networks, provides clear answers. Top Destinations There are no surprises at the top. Croatia remains the number one destination for Slovenians. Despite growing debate about rising
Newborn Names – A Growing Pool
As the range of consumer choices has expanded over the past 30 years, so has the range of names parents choose for their children. Name Diversity According to data from Republic of Slovenia Statistical office in 1999 there were 187 different female and 190 different male newborn names. By 2024, these numbers had grown to
Newborn Names – Getting Shorter
If it feels like newborn names are getting shorter, you are not imagining it. Past Trending Data from the Statistical Office of the Republic of Slovenia show that in 1992 the average name length was 5.2 letters for girls and 4.9 letters for boys. By the early 2020s, the average for both had dropped to
Total Articles: 28
Divorces in Slovenia – Stable in Numbers, Shifting in Nature
Number of Divorces Data from the Statistical Office of the Republic of Slovenia shows that the number of divorces in Slovenia is declining. In each year from 2022 to 2024, around 2,200 divorces were recorded annually. Excluding the COVID year 2020, divorce numbers were last this low in 2000. Given the parallel decline in marriages,
Marriages in Slovenia – Declining and Shifting
The number and rate of marriages in Slovenia, as in the wider region, are in decline. Marriage has shifted from a near-universal early-life milestone to a selective mid-life choice. Marriage Trends According to data from Republic of Slovenia Statistical office covering period from 1988 to 2024, the highest number of marriages was recorded in 1989,
Who Visits Slovenia and When
Which foreign tourists visit Slovenia the most, and when do they come? Experimental data from the Statistical Office of the Republic of Slovenia, based on foreign mobile users roaming on Slovenian networks, offers a detailed view. Top Visitors According to the data, tourists from Austria (13.3%), Germany (13.1%), and the Netherlands (12.3%) account for almost
Where Slovenians Travel and When
Where do Slovenians like to travel, and when do they go? Experimental data from the Statistical Office of the Republic of Slovenia, based on mobile users roaming in foreign networks, provides clear answers. Top Destinations There are no surprises at the top. Croatia remains the number one destination for Slovenians. Despite growing debate about rising
Newborn Names – A Growing Pool
As the range of consumer choices has expanded over the past 30 years, so has the range of names parents choose for their children. Name Diversity According to data from Republic of Slovenia Statistical office in 1999 there were 187 different female and 190 different male newborn names. By 2024, these numbers had grown to
Newborn Names – Getting Shorter
If it feels like newborn names are getting shorter, you are not imagining it. Past Trending Data from the Statistical Office of the Republic of Slovenia show that in 1992 the average name length was 5.2 letters for girls and 4.9 letters for boys. By the early 2020s, the average for both had dropped to
Total Articles: 38
DAX HANDBOOK
7. VARIABLES
Variables are used in almost every measure you will create. The reason we introduce them last is that they use all other parts of DAX code to produce faster, more powerful and maintainable code. Variables are like containers of a part of the DAX code which can be used throughout your measure. Few facts about
DAX HANDBOOK
6.8 ALLSELECTED
Explanation ALLSELECTED is one of the most complex functions in DAX. When used improperly it can lead to unexpected results. As a rule of thumb, you should not use it in iterative functions. It is preferable to use it only as a CALCULATE filter remover, not as a table function. ALLSELECTED comes into play once
DAX HANDBOOK
6.7 Lineage
What is Lineage? Lineage is a part of DAX mechanics that enables us to use tables as filter arguments for the CALCULATE function. It’s also used in row2filter context transition and other aspects of the data model that involve filter propagation throughout the model. We can state that lineage is the possibility to filter the
DAX HANDBOOK
6.6 Crossfilter
Crossfilter is a feature of DAX when it filters the underlying dataset even though there aren’t any visual filters present. Introduction In this example, we will explain a very important feature of CALCULATE filter arguments. We will also explain why you should always prefer the combination of ALL/REMOVEFILTER + VALUES instead of ALLEXCEPT function. We
DAX HANDBOOK
6.5 Expanded tables
When using whole tables as filter arguments to CALCULATE, you are using an expanded version of the model, which consists of the table used in the arguments, as well as all other tables in the data model that are linked to that table through a 1-* relationship. We will explain this concept with a small
DAX HANDBOOK
6.4 CALCULATE order of evaluation
Explanation CALCULATE has an evaluation order different from most other DAX calculations. We can say that it works from outer to inner CALCULATE statements. Let’s explain this with an example: Which value would the SalesMultipleCalculate measure return?a) Blank valueb) 33,702,965 (Black)c) 10,828,592 (Blue) The correct answer is B. Following is the explanation and order of
Total Articles: 14
Dynamic Coalesce in PowerQuery
We can define coalesce in PowerQuery as the last value existing in a single row of multiple columns positioned from left to right. In our example that would be the last value from the month columns. In this article, we will show you how to create both static and dynamic formulas for coalescing. If you
Merging with date range using Power Query
In this blog, we will see how to merge two tables in Power Query based on key column and a date range. Merging with multiple matching columns is straightforward and can be achieved in Power Query by selecting merge queries option and holding CTRL key when choosing matching columns like in the picture below:
How to process multiple folders with a single PowerQuery script
Let us imagine the following scenario. We have multiple clients sharing their sales data with us. They store the data in dedicated folders that reside in different places. The number of clients, as well as the number of files for each client, will vary across periods. We wish to create an automatic refresh system that
Dynamically expand table or record columns in Power Query
In this article, we will show how to solve a common problem of expanding nested tables or records in Power Query, when the column names of the nested objects vary in numbers. In the second part of the article, we will show a more robust technique for dealing with changing structures of the nested tables.
How to track changes in the table in Power Query
If you ever had a need to check if anything changed in the new table compared to the previous export, no matter in which column, then this is the article for you. We have created an M script in Excel that uses the left anti join to check for data inconsistency. it works with any
Split packs into single products in Power Query
This is going to be an easy-to-follow article on how to use PowerQuery to easily change source data granularity for only a subset of data. We used a client’s request to split packs into its components as an inspiration to write this post. You can also download Excel workbook and follow along. Sometimes in the
Total Articles: 3
Dynamic bulk insert to Power Apps collection
In one of our latest blog posts, we described a technique used to copy tables from other programs (e.g. Excel) into PowerApps collections. This solution had a drawback. Within the code, the column order was referenced to determine which column to collect. This means that, for the first column in the PowerApps collection, it gets
Bulk insert to Power Apps collection
In this blog, we will show you the technique used to collect tables for your app by using the bulk insert. We will show you how to make the same table structure in Power Apps as Excel tables. We will use Excel to show you how to copy-paste tabular data from it and collect it
Why should you start using Power Apps?
In this article, we will take a look at what is Power Apps, why should we use it, and when organizations can benefit from custom apps created in the Power Apps platform.Many organizations are not yet familiarized with Power Apps capabilities, and the ways it can improve their agility, modernize and automate manual processes. What is Power Apps? The official Microsoft
Autori

Krešimir Ledinski
Microsoftov certificirani stručnjak u području poslovne inteligencije. Najveće su mu strasti DAX, M i modeliranje podataka.

Kristian Radoš
Iskusni analitičar podataka. Napredan u SQL, PowerApps i M jeziku.


