


What is Lineage?
Lineage is a part of DAX mechanics that enables us to use tables as filter arguments for the CALCULATE function. It’s also used in row2filter context transition and other aspects of the data model that involve filter propagation throughout the model. We can state that lineage is the possibility to filter the data model based on physical or virtual relationships.
The easiest way to explain this concept is through an example. We will use the following 2 measures to compute sales of only Black color.
LineagePreserved =
CALCULATE(
    [TotalQTY],
    FILTER( VALUES( DimProduct[Color] ), DimProduct[Color] = "Black" )
)
LineageLost =
CALCULATE(
    [TotalQTY],
    FILTER(
        UNION( VALUES( DimProduct[Color] ), { "Purple" } ),
        DimProduct[Color] = "Black"
    )
)

As we can see, the first measure shows only values of Black color. The second measure simply ignores the CALCULATE argument, meaning it does not preserve the lineage of DimProduct[Color] column against the data model. The data lineage was broken by using a UNION function. The result of UNION function is a list of values not connected to a data model. We can represent the result of a UNION function with the following code.
LineageLost_Explained =
CALCULATE(
    [TotalQTY],
    FILTER(
        {
            "Black",
            "Blue",
            "Multi",
            "NA",
            "RED",
            "Silver",
            "Silver/Black",
            "White",
            "Yellow",
            "Purple"
        },
        [Value] = "Black"
    )
)
CALCULATE argument is now a list of values that have no real connection to a data mode, meaning the result of the FILTER function has no impact on the calculation.

What can break the data lineage?
Using a UNION function is one way to break a Lineage. Other most known are:
Using SELECTCOLUMNS function with a complex expression
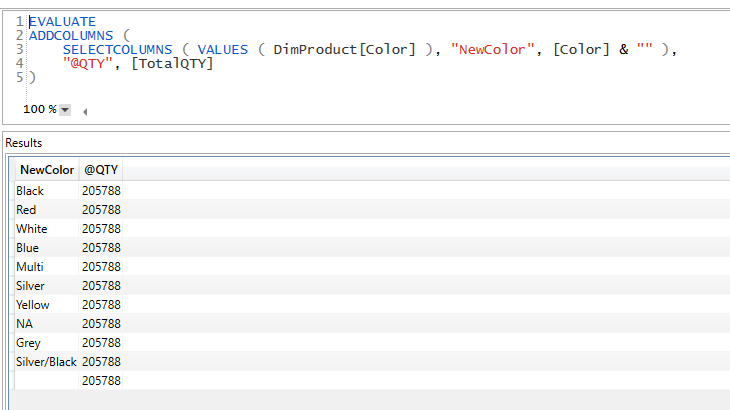
Data lineage is lost because we added an empty string at the end of each iteration of the DimProduct[Color] column. Now colors of each row of an iteration are no more than values. When row2filter context transition occurs, those colors have no lineage to a DimProduct[Color] column and cannot be used to filter the data model.
Trying to use a result of an expression as a filter
To explain this concept we will try to find the MAX product key under a given filter context (this calculation is used solely for the purpose of explaining the concept, it has no real-life application). Then we will use a result of a measure to transfer that product key to the Forecast table. The model looks like this:

We will use the following measures to explain the difference.
MAX_Product = MAX(FactSales[ProductKey])
TotalForecastQTY = SUM(Forecast[ForecastQTY])
MaxProductForecast Wrong =
VAR MaxProduct =
   {[MAX Product]}
RETURN
    CALCULATE(
        SUM( Forecast[ForecastQTY] ),
        MaxProduct
    )

As we can see in the picture above, there is no difference between the results of [TotalForecast QTY] and [MaxProductForecast Wrong] measures. In the [MaxProductForecast Wrong] we tried to use a scalar result of a measure (transformed into a table object with the use od {} brackets) as a filter for the CALCULATE argument. This won’t work because using measure results cannot be directly used to form a filter context. But with a slight adjustment to the code, we can introduce lineage to the calculation above and force the scalar result of a measure to become a proper CALCULATE filter argument.
Using TREATAS
To force lineage execution we can use a TREATAS function. When used as a CALCULATE argument, TREATAS can supply a list of active values for the selected column/s. Following is its syntax:
TREATAS(Expression as a table, Column1, Column2, Column…n)
In case you supply multiple columns table as a first argument, you have to supply an equal number of columns from the data model as Column arguments. The order in which you supply columns also matter and has to be the same as the order of the table columns in the first argument.
To force lineage in the above example, we can use the following measure.
MaxProductForecast =
VAR MaxProduct =
   {[MAX Product]}
RETURN
    CALCULATE(
        SUM( Forecast[ForecastQTY] ),
        TREATAS(MaxProduct,Forecast[ProductKey])
    )

As we can see in the picture above, [MaxProductForecast] now computes a correct result for each MAX product. We used TREATAS to force measure result to become a table result applied to a Forecast[ProductKey] column.
TREATAS in this manner is mostly used for code optimizations in certain situations and in more advanced DAX coding.
TREATAS virtual relationship
The basic usage of TREATAS function is to form a virtual relationship between the table supplied as a first argument and columns of the data model. In case the table in the first argument has more than one column, you need to provide the same number of columns in TREATAS second arguments.
For example, if we have a discontinued table such as Forecast one in the data model below, we can still filter it using TREATAS.

We want to move DimProduct[ProductKey] and DimDate[Year-Month] columns from the data model onto a discontinued Forecast table. We will use the following 2 measures.
TotalForecastQTY = SUM(Forecast[ForecastQTY])
ForecastQTY_TREATAS =
CALCULATE(
    [TotalForecastQTY],
    TREATAS(
        SUMMARIZE( FactSales, DimProduct[ProductKey], DimDate[Year-Month] ),
        Forecast[ProductKey],
        Forecast[Year-Month]
    )
)

As we can see, [TotalForecastQTY] doesn’t filter the Forecast table and shows always the same figures.
[ForecastQTY_TREATAS] uses SUMMARIZE to form a virtual table with 2 columns having grouped values from the data model (DimProduct[ProductKey] and DimDate[Year-Month]). Then we use that values as a set of filters for the Forecast[ProductKey] and Forecast[Year-Month] columns.
While moving filters, TREATAS ignores all non-matched values between the source and destination columns. This means you won’t get a blank row in case of non-matched values were present in the source table. We can show the difference if we create proper 1-* relationships between dimensions and the Forecast table.


We can now clearly see that there are 356 quantities of non-matched values that are not being shown if we use TREATAS to move the filters virtually. With relationships in place, the missing quantity is summed under the blank row that was automatically added by the engine to handle missing relationships.
TREATAS what to be aware of?
TREATAS is a function that can help you set the lineage over disconnected tables or reinstall it if it is lost due to specific situations mentioned above. That being said, you need to understand its applications to the data model, which are the following:
- Filters moved through TREATAS lose the ability to show non-matched values as a blank row in a visual.
- If used on high cardinality columns, it can have a significant impact on the calculation performance.


