


Explanation
Grouping table functions have only one purpose, and that is to create a distinct combination of columns/tables supplied. Grouping functions are mostly used as intermediate steps in DAX code.
Most use cases:
- Create a set of values on a higher granularity which you need to iterate upon
eq. Find the best-selling product in each category of products. To achieve this, you need to create a list of all the distinct products in each category alongside their sales. to create a such list, you need to use a grouping function called VALUES. - Supply a table as an argument to the CALCULATE function which will alter the original filter context.
We will explain this later on in the CALCULATE article series.
The most widely used grouping functions are:
- VALUES
- ALL
- SUMMARIZE
- CROSSJOIN
The difference between VALUES and ALL function is that VALUES accepts filter context coming from the visual, while ALL ignores it.
Let’s observe the results in the visual below.
The measures used are the following:
ALL Sales = COUNTROWS(ALL(Sales))
VALUES Sales = COUNTROWS(VALUES(Sales))
ALL ProductName = COUNTROWS(ALL(Sales[Product]))
VALUES ProductName = COUNTROWS(VALUES(Sales[Product]))
CrossJoin = COUNTROWS(CROSSJOIN(VALUES(Sales[CategoryName]),VALUES(Sales[SizeRange])))
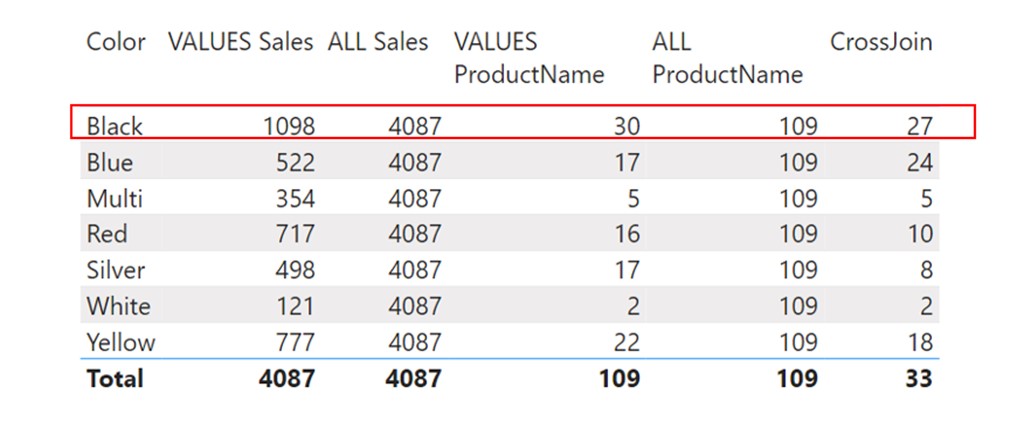
Notice that every measure has a grouping table function wrapped inside of a COUNTROWS function. We must use COUNTROWS function to aggregate multiple rows of data that the table functions return into a scalar value which can be shown in a cell of a visual. We will use DAX Studio to show tables that each of the functions wrapped in COUNTROWS return. We will focus solely on the first row in the visual, which has one condition forming the original filter context for that row. The condition is Sales[Color]=”Black”.
VALUES vs ALL Function
First, let us explain how the measure [VALUES Sales] returns the number 1098 in the first cell.
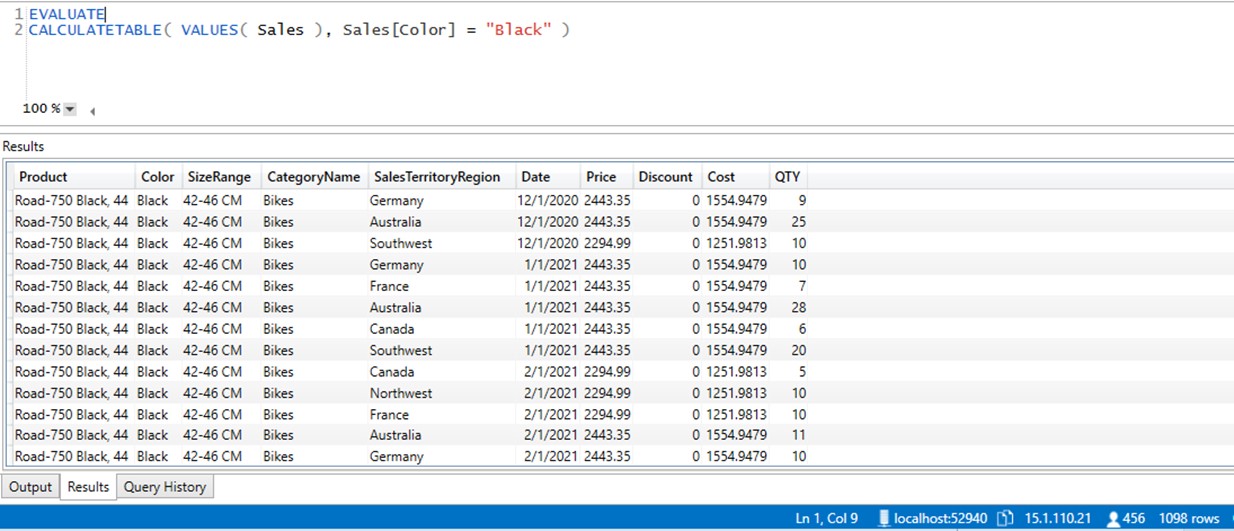
In DAX studio we use CALCULATETABLE to imitate filter context coming from the visual. When the original filter context is applied to the VALUES(Sales) expression, the table returns only rows with black color. The number of rows that survived the original filter context is 1098, as shown in the bottom right part of the DAX Studio window. Measure uses COUNTROWS function which accepts this table as input, then counts the number of its rows and returns 1098 as scalar value to the first cell in a visual.
What happens when we use ALL function?
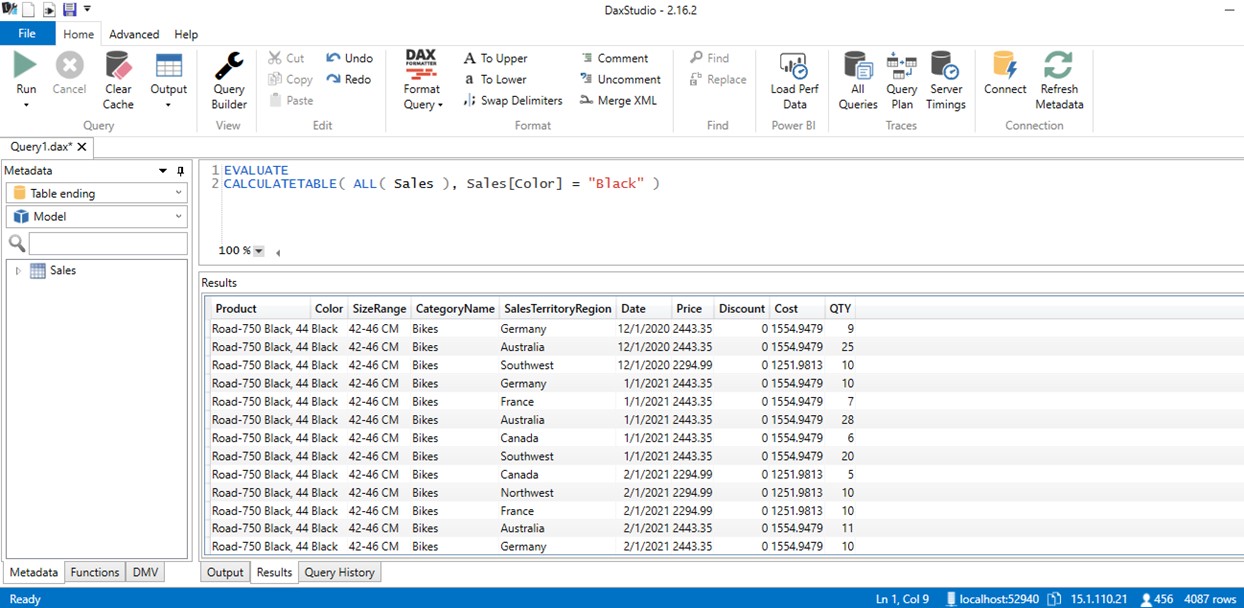
Even though we use CALCULATETABLE to imitate the original filter context, when the calculation starts the Sales table is wrapped in ALL function. ALL function ignores original filter context and returns the whole Sales table. The number 4087 is the number of rows in the Sales table without any filters applied.
Single Column Argument
It seems logical so far, now let’s explain the 3rd measure [VALUES ProductName], which returns the number 30.
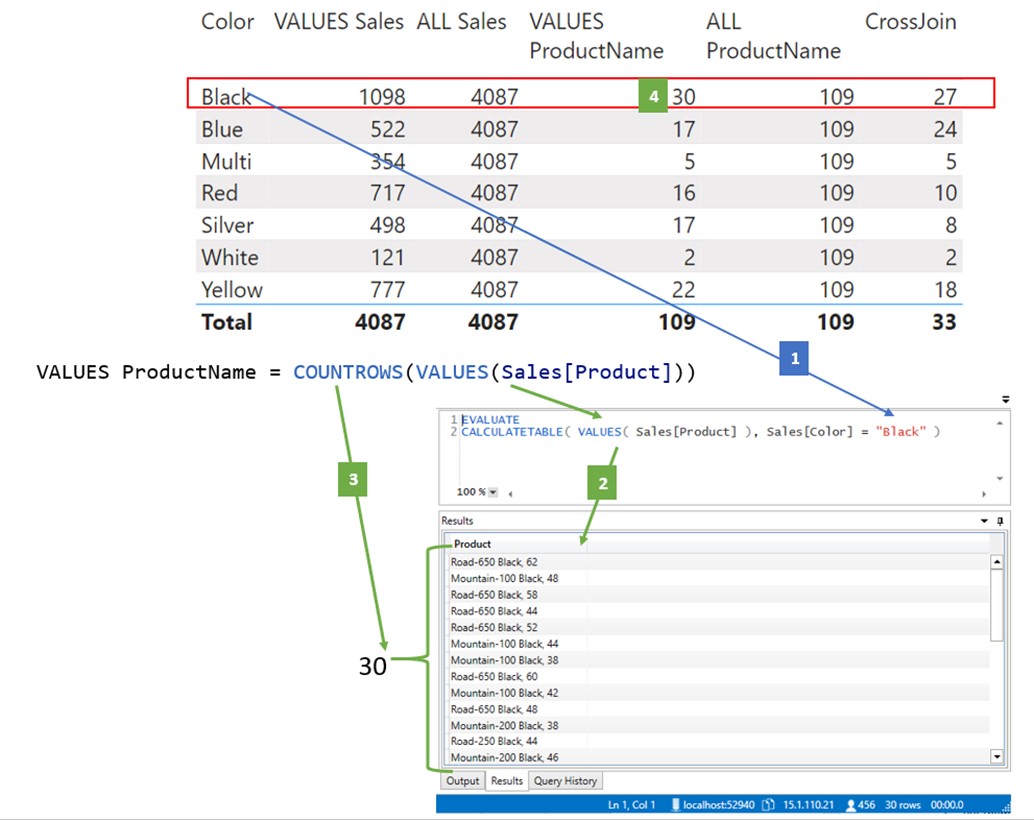
- The original filter context (Sales[Color]=”Black”) is imitated in DAX Studio with CALCULATETABLE function.
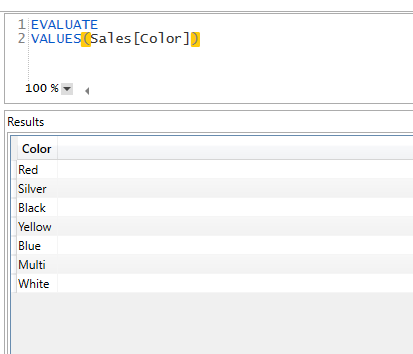
- The VALUES(Sales[Product]) function returns a unique list of products filtered by the “Black” color condition coming from the visual.
VALUES function can accept single column or a whole table as an argument. ALL function can accept multiple columns or a whole table as an argument. When VALUES is used with a single column, it returns a list of distinct values of that column. The list of distinct product VALUES function returns can only be shown through DAX Studio.
- COUNTROWS function accepts the list object created with VALUES function, which contains only unique black products, and counts its rows.
- There are 30 different products of black color, which COUNTROWS function counted, translated into a scalar, and returned into the corresponding point in a visual.
When we use ALL instead of VALUES, the ALL function ignores the original filter context and always returns the whole list of distinct products. COUNTROWS counts the number of rows, which is always the same figure of 109.
SUMMARIZE
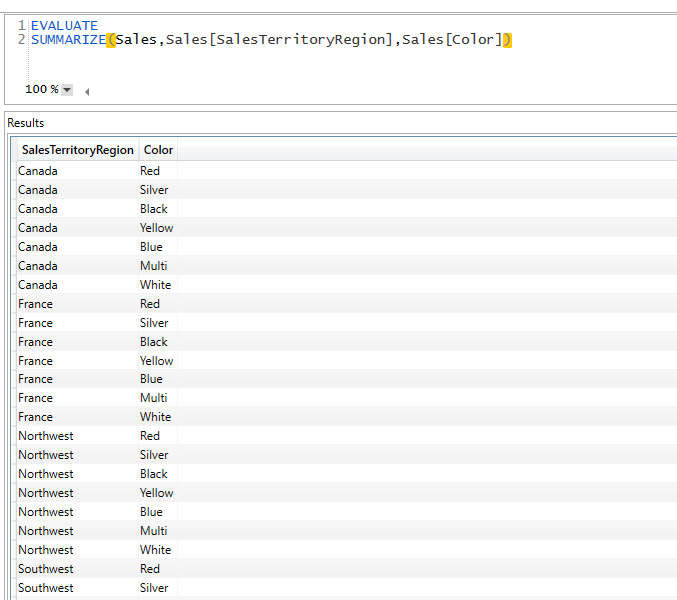
SUMMARIZE is used in case we need to group values from the data model with 2 or more columns involved. In case we wish to group values of a single column, we can use the VALUES function.
On the other hand, if we try to group multiple columns with the VALUES function, we receive an error.
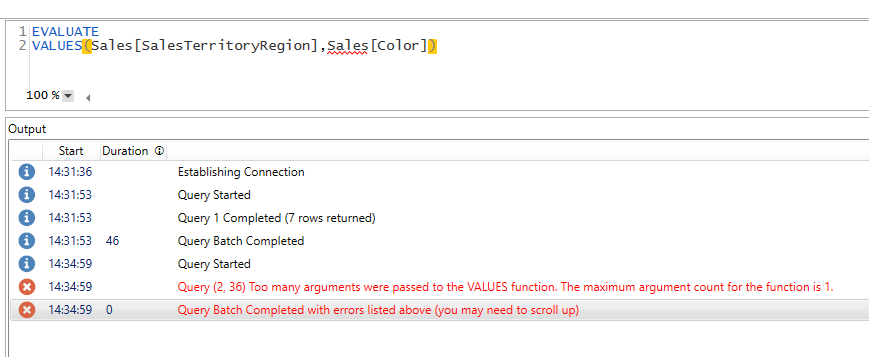
This time we need to use SUMMARIZE function, which can group multiple columns from the data model.
You can find more on SUMMARIZE function in our Mixed table functions article.
CROSSJOIN
CROSSJOIN function accepts 2 tables/table functions and creates a unique combination of values from both tables.
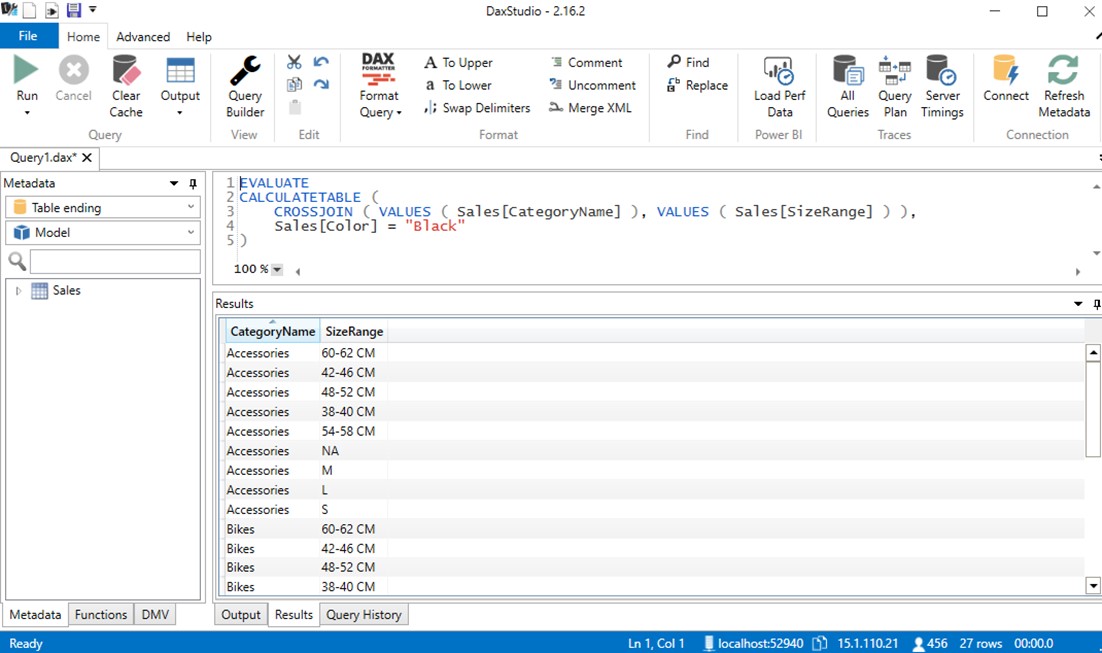
When using CROSSJOIN you can choose to ignore or accept filter context for each table supplied as an argument to the function. The following is also a valid CROSSFILTER function that returns all possible combinations between Sales[CategoryName] and Sales[SizeRange] columns.
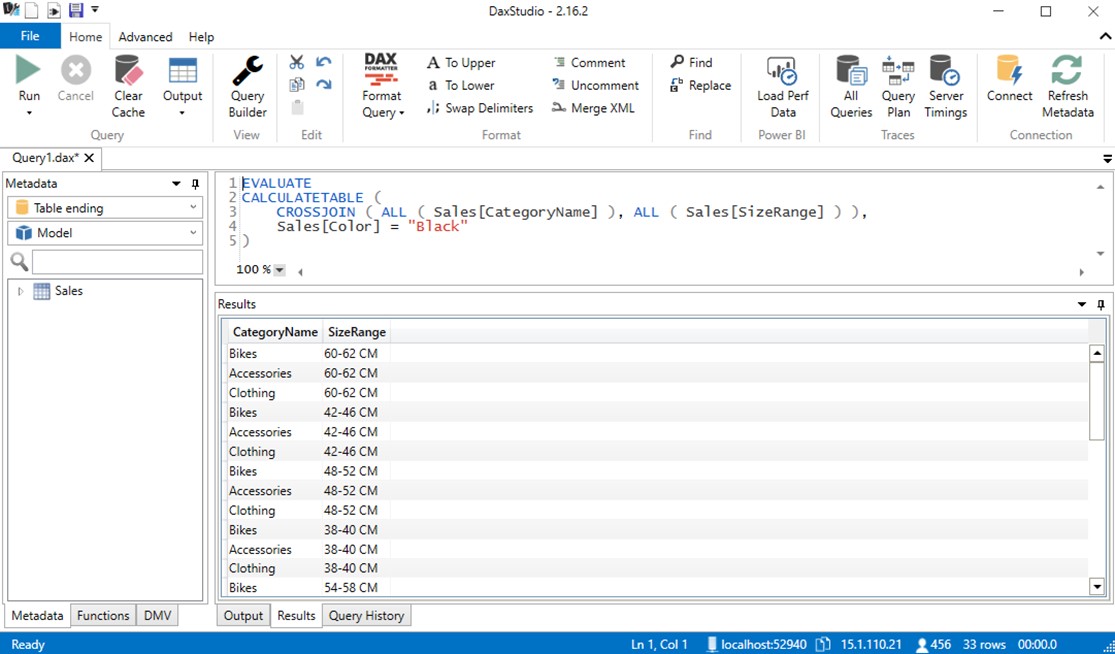
As we can see there are 33 possible combinations between these tables, as opposed to 27 when under the influence of the original filter context Sales[Color]=”Black”.
Grouping Table functions usage
At the moment, you might have no idea why you would need to know about these kinds of table functions, but they play a key role in DAX modeling, especially in a combination with CALCULATE, where they can be used to iterate upon or modify the original filter context. You need to have a good understanding of this topic before starting the CALCULATE chapter.


