


Columns Overview
In general, the data model consists of Tables. Tables consist of Columns. Columns are used to form Filter context by plotting them on the canvas in filter fields. They are also used as building blocks of DAX Measures. We can say that columns are the most used objects in data modeling. In import mode, there can only be 2 types of columns:
- Imported column – columns coming from the data source
- Calculated columns – additional columns added from within the data model and created using DAX
Calculated columns are used to enrich your data model with additional, physically stored columns. A calculated column is always a part of a table and static in its nature.
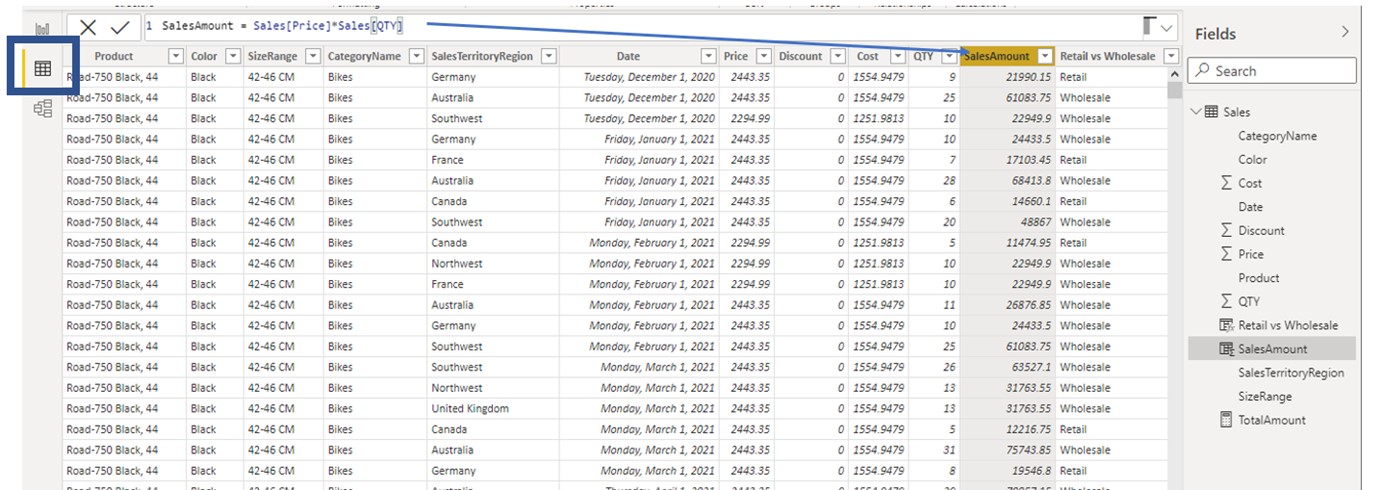
In our demo model, we have a single table called Sales. In the Power BI table view (blue square in the picture above) we can see the structure of the selected table. Sales[SalesAmount] is a calculated column with the calculation SalesAmount = Sales[Price]*Sales[QTY]. If we observe values in the selected column, they change for each row of the table.
Someone coming from an Excel environment who is used to references finds this operation hard to grasp. How can the same formula produce different results for different rows of the table?
Row context concept
It does so because of a row context concept. The row context concept means that each row calculates the same formula, but since for each row there are different figures going in the calculation, so does the result differ.
When DAX operates in a row context, the following rules apply.
- The same formula applies to each row of the table
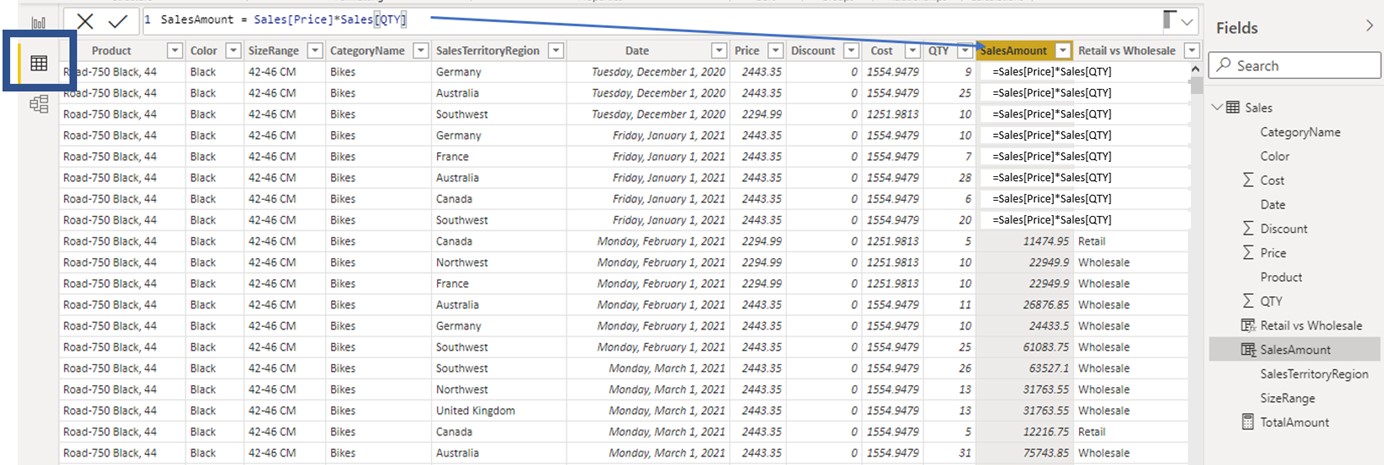
The value of each row in a calculated column is evaluated independently and in parallel.
- Each row can only see values from other columns of the same row (row record)
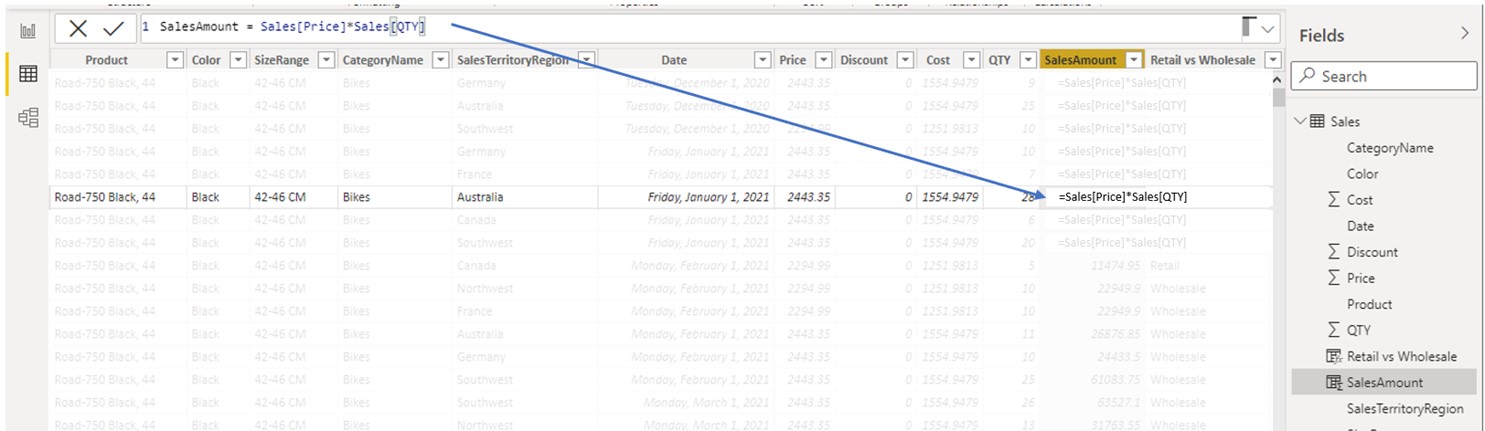
If we focus on the highlighted row, the same formula now operates on values of adjacent columns of the same row. When in row context, we can access any other column from the same row, but we cannot access values from other rows.
- There is no direct way of accessing other rows in a table
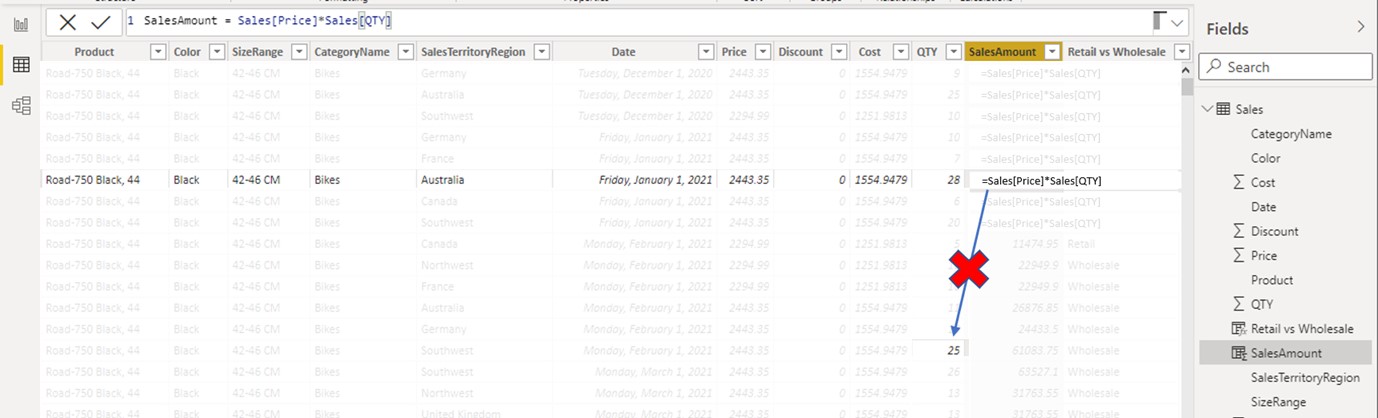
When working in a row context, the current row can only see values of the same row. For the highlighted row, the formula Sales[Price]*Sales[QTY] can only multiply the price of 2443.35 and the quantity of 28. There is no direct way we can tell the calculation to multiply the price by the value of the row 8 “cells” below the current one. If we observe the Power BI table view, we can see that rows aren’t indexed. There is no row 5, 10, 50, etc. Each row is a row for itself. A row cannot be accessed with a row reference (like in Excel where we could use references to access different rows of the same column (e.g. D10 * D50), but instead we need to use other techniques involving filtering to acquire similar results. Those techniques will be explained in later chapters.
Row context is one of the most important concepts in DAX. It is always present in Calculated Columns. We can also invoke virtual row context in a measure using iterative functions, which will be explained in the next chapter.
Calculated columns usage
Calculated columns can be used to return values or text. They should be used with care, especially in big models, because they consume the RAM memory of the model. And the more memory they consume, the bigger the model, the slower overall model performance.
Calculated columns are mostly used for the following purposes:
- Adding additional Value columns (e.g. SalesAmount column in our previous example).
- Adding additional Filter columns based on the conditions included in a formula.
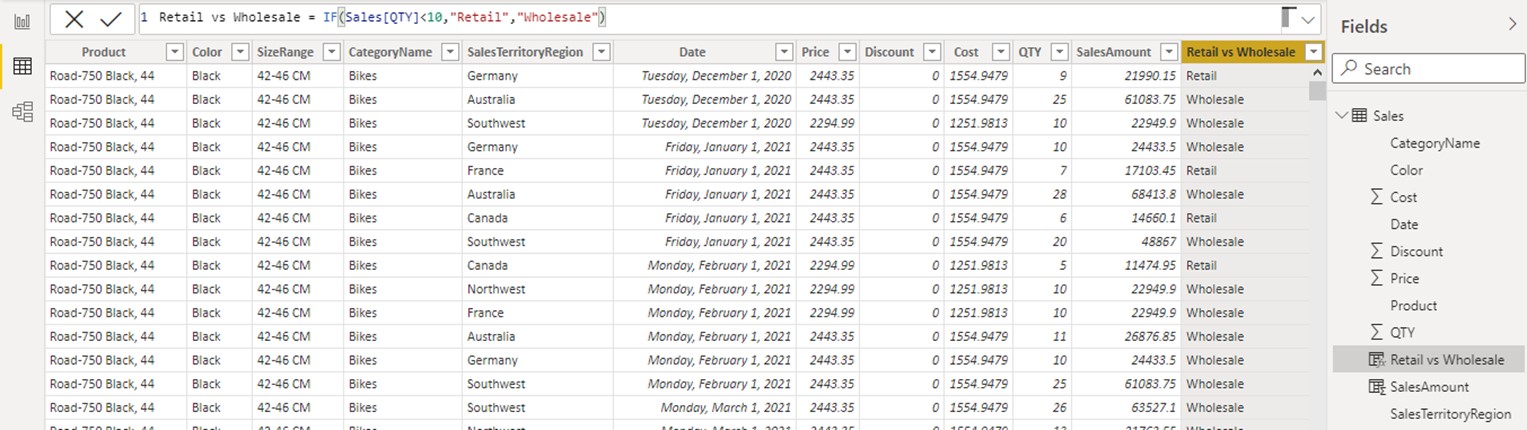
E.g. Retail vs Wholesale is a calculated column in which we define “Retail” sales as sales with more than 10 QTY sold. We can now use that column as a filtering column in a visual.
Evaluation order for the picture above:
- We created a calculated column in a table Sales called [Retail vs Wholesales].
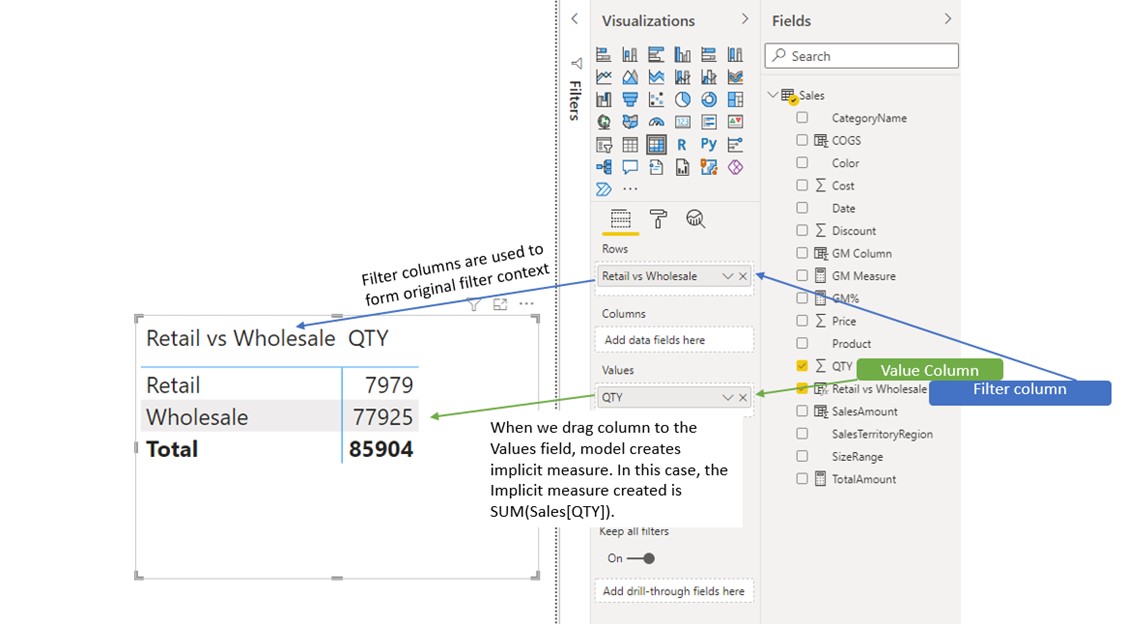
• The calculated column is created in a row context of the Sales table. - We can now plot that column on the visual and use its distinct values to form the original filter context.
- When we drag Column into a Values field of the visual, the model automatically creates an implicit measure and aggregates the data. In the case of a numeric column, the default aggregation is SUM. In the case of a Text column, default aggregation is First.


