


This section will explain why you would need a data model (having all the data in a single table is never a good practice), and the differences between dimension and fact tables. We will start this section first by understanding the most important data modeling rules, and those are the distinction between the filter and final values. If you work with structured data sources (database, DWH, etc.) then you will rarely think about these distinctions since you will have data prepared (in most cases) in an optimal way, but in the case of working with unstructured sources (exports from systems, web data, Excel files, etc.) the following few chapters will be of great benefit for you and will keep you from making rookie mistakes in your data models.
Filter Columns
Is the data in the table below in optimal form?
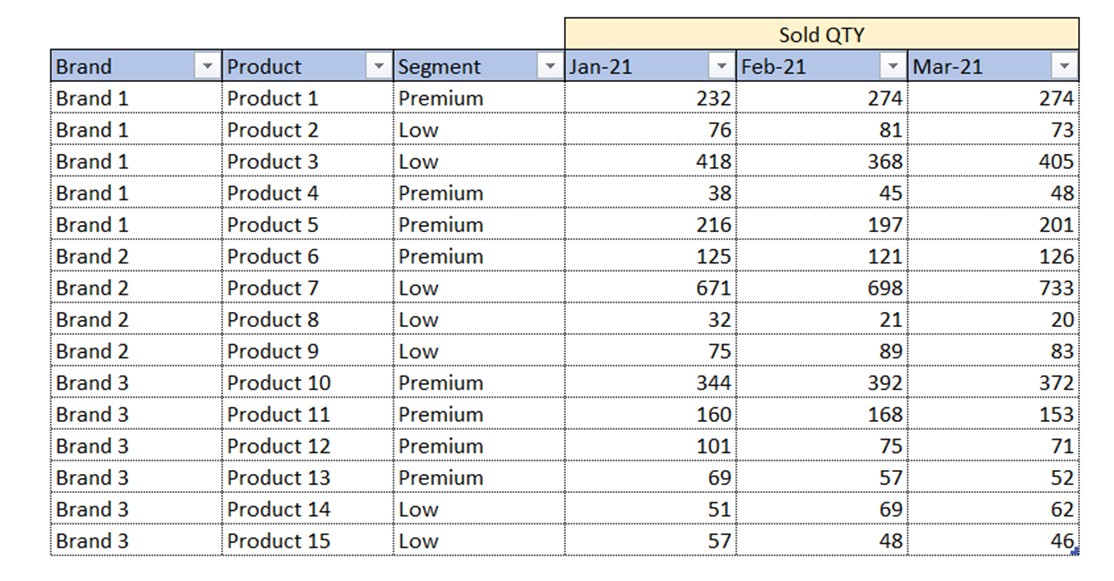
Even though the data is represented in a table form, this table is not in an optimal form. We have 3 columns with descriptive values (Brand, Product, Segment). We also have 3 columns with numbers we wish to analyze. All these 3 columns represent Sold QTY values. Those values are split into 3 columns based on dates. Dates are, by nature, also descriptive values (same as Brand, Product and Segment columns).
The rule is: All descriptive values of same nature (in this case dates) must be in their own single column which has the name most suitable for describing those values.
In our case the table from above should be transformed into the following table:
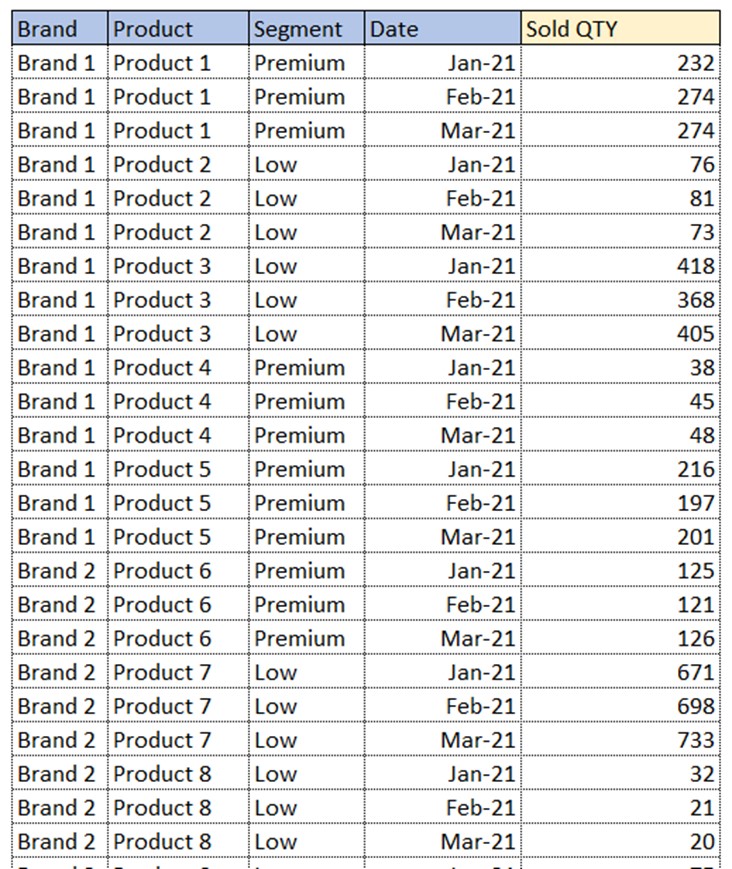
All the dates are put in a single column, called Date. Now we have 4 columns with descriptive values and one column with numbers we wish to analyze. These 4 columns are called Filter columns. We mostly use filter columns to:
- Put them in visuals on columns, rows, axis, filters and other fields which are used to perform filtering of the data
- Iterate through them with iterative functions (SUMX, FILTER, etc.)
- Use them to return COUNT/DISTINCT number of rows in table
- Use them as CALCULATE arguments to modify filter context
Value Columns
Now that we understand filter columns, let’s check if the following structure is optimal.
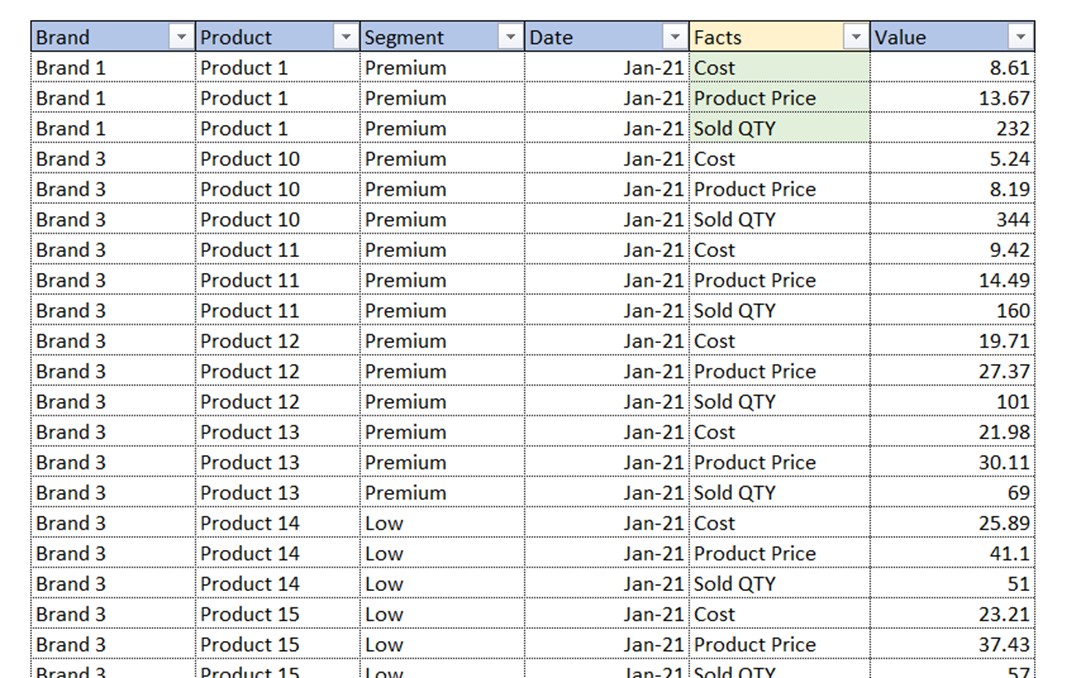
At the first sight, it seems ok. We have 5 descriptive columns and 1 column with values. But let’s focus on the Facts column. In it, we have 3 different facts (Cost, Price and Sold QTY). Those are not descriptive values of the same nature, but rather completely different descriptions of completely different final values we would want to analyze separately. Focus on the word final. We want to put all the final values of the same nature in their own columns! This table should be transformed into the following structure.
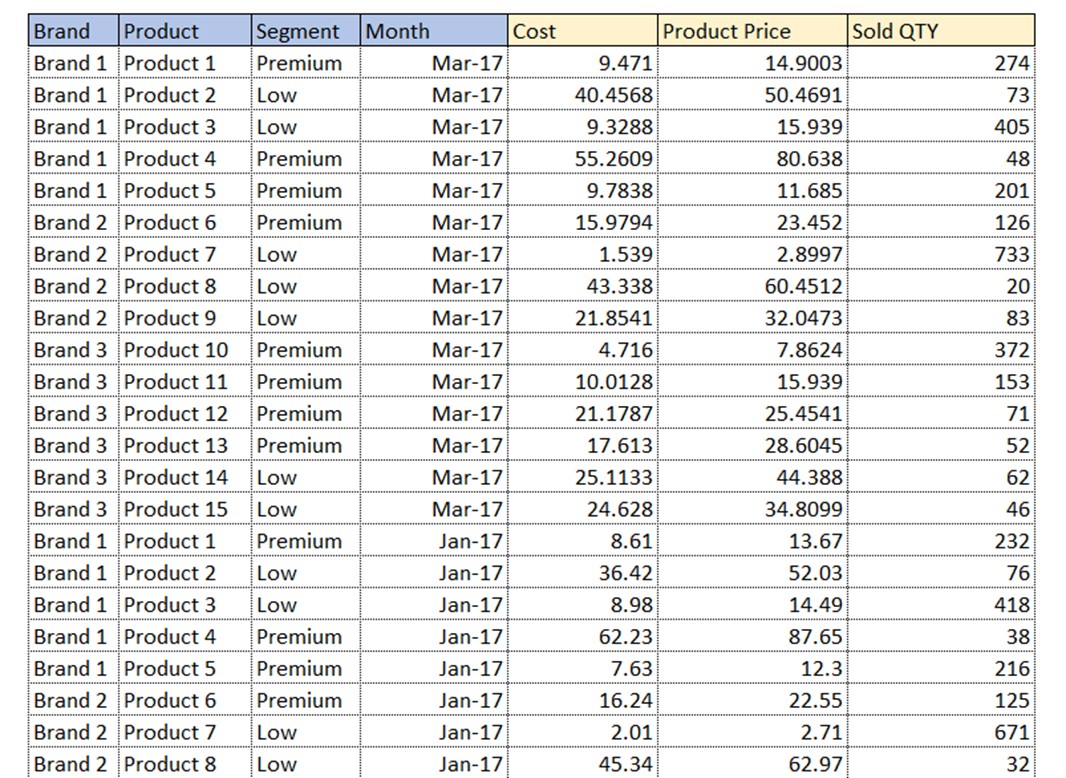
Now we have 4 filter columns and 3 value columns. Value columns consist of values we wish to analyze and in one value column must be only a unique type of value (e.g. Cost, Price, Qty). We mostly use value columns to:
- Use them in Measures to produce results we would put in the values field of the visual
- Group them to form filter columns
Above are the general rules of using filter and value columns. In Measure you will use both types of columns, but in different parts of measures.
Dimensions vs Fact Tables
So far, we explained 2 main types of columns in a single table. Now let’s explain the 2 main types of tables. When working with Power BI data models, the best approach is to use a star schema. Star schema consists of multiple Dimensional tables linked to one or more Fact tables.
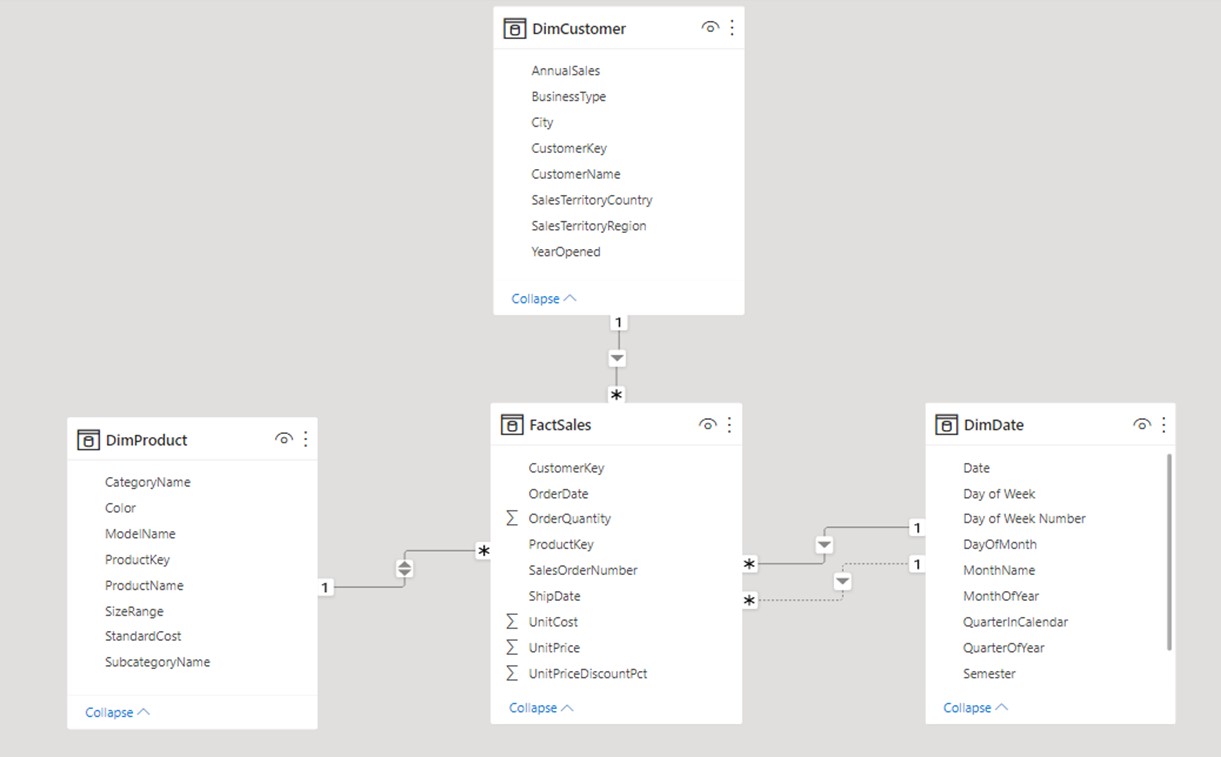
In our example, we have 3 dimensional tables (tables with the prefix “Dim”), and a single fact table called FactSales. Dimension tables are tables that mostly consist of filter columns. They all have one column, called Key column, through which they connect to, and filter the fact table.
Key column is the column that consists of unique values and its granularity is the same as the granularity of the linked column in the FactTable. In database systems, key column is often a unique identifier (guide, string, or unique number combination). In non-database systems (e.g. data coming from Excel files), that key can be any column with unique values. For example, if your model is based on Excel files, and you wish to analyze sales by products and its descriptions (segment, brand, category, etc.), you can use product names as a key column, as long as each product name is unique.
Except Key column, there can be numerous other filter columns or even a few value ones. We can see that in DimProduct table we have 7 additional columns, 6 filter types, and one of the value type ([StandardCost]). Those columns have only one purpose, and that is to further describe the value of the same row in the key column.
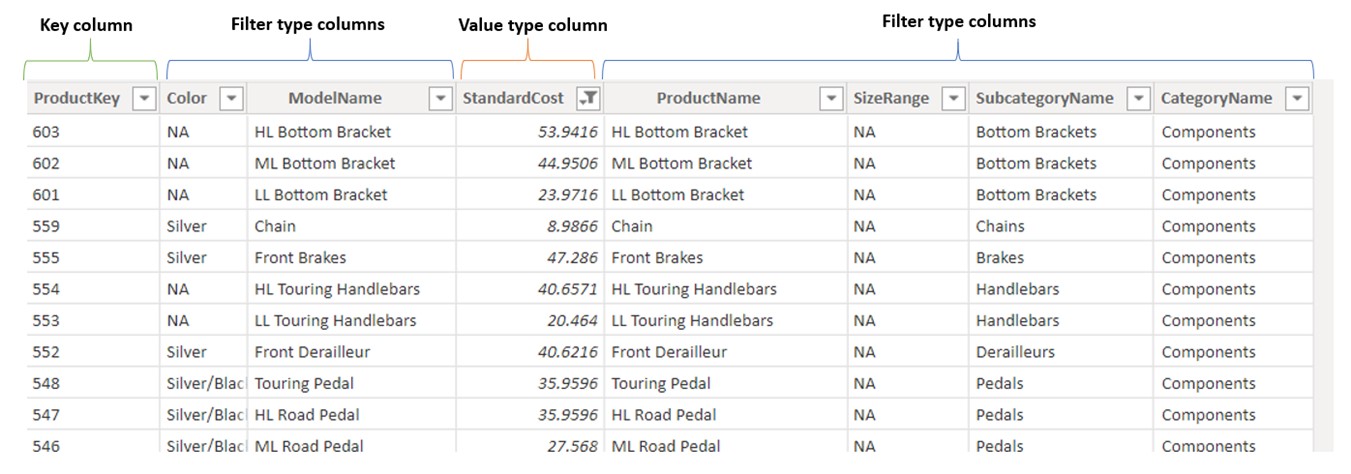
If we focus on the first row in the DimProduct table (ProductKey = 603), all other columns further describe that product. So, product 603 has NA color, costs 53.94$, is of category Components and its name is HL Bottom Bracket. If we didn’t have [ProductKey] column, we could also use [ProductName] column as a key column, as long as all the descriptions of the products are unique and will tend to stay unique in the future. The other prerequisite is to also have product names as a column in the fact table. Then we could create a relationship between those 2 columns.
How to Define Dimension Scope?
Dimensions are often defined by business areas. If you sell products, you will have a product dimension with all the descriptions of products. If you sell products to multiple customers, you will have a customer dimension with information about the customer (e.g. address, region, customer status, …).
An optimal number of dimensions depends on the number of business areas you wish to include in the data model.
Where do you define the number of business areas?
You define that number in the fact tables. As opposed to dimension tables, which consist mostly of filter columns, fact tables mostly consist of value columns. Other columns present are foreign key columns, with only a few, if any, filter column types. The number of business areas (Dimensions) is defined by the number of foreign key columns. This is also called the fact table granularity.
Let’s say that we have a sales fact table, and the data in it is on the level of the receipt, meaning it has information about the customer, date of purchase, exact products he/she purchased, the person who sold it, and store the purchase was made in. From this fact table, we can read that we would need to make 5 different dimensions. Each dimension could have multiple descriptive columns
• DimCustomer – (key column could be CustomerID), description columns: Customer type, Age, Gender, Location, etc.
• DimDate – (key column Date), description columns: Year, Month, Quarter, Weekday, etc.
• DimStore – (key columns StoreID), description columns: Location, Region, Size of store, Store manager, etc.
• DimProduct – (key column ProductID or ProductName or EAN code), description columns: Name, Brand, Segment, Type, etc.
• DimEmployee – (key column EmployeeID), description columns: Age, Gender, Position, Wage, etc.
Let’s emphasize this sentence, which is true in most cases:
The granularity of the fact table defines the number of dimensions!
In our example we have 5 key columns in the fact table, then why do we have only, 3 dimensions?
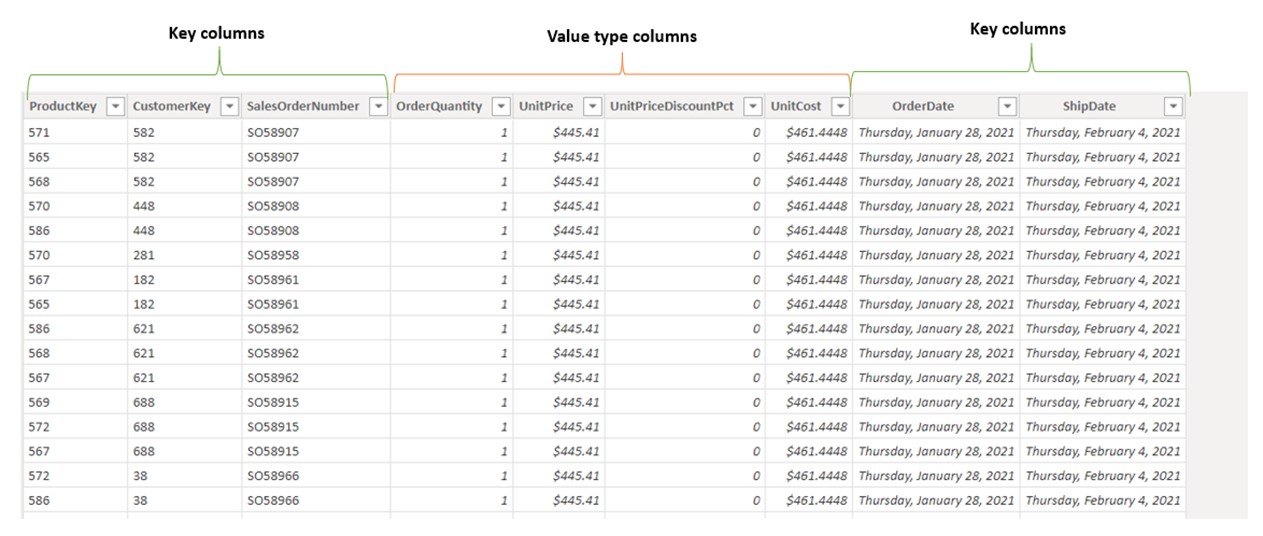
[ProductKey] and [CustomerKey] columns are used as foreign key columns for DimProduct and DimCustomer. OrderDate and ShipDate are both the same type of dimension called DimDate. [SalesOrderNumber] column can be used as a dimension, but we decided not to go into such depth of analysis. In that case, this column can be used as a value type column, and can give us important information such as the number of orders or maximum sales per order.
What are the differences between key columns in the fact table compared to a key column in dimension?
In dimensions, key columns should always have unique values in the key column, while in the fact tables this is not the case. We can see in the picture above that customer keys are appearing more than once. Actually, it is being repeated for each product sold within the same sales order. Multiple key values can occur in every key in the fact table, that’s why we call that column a foreign key, or key on the many side of the table.
Why Use Dimensions Instead of a Single Big Table?
There are many reasons in favor of using star schema. The most important ones are:
- DAX code is easier to write and debug
- It’s easier to depict which columns belong to which area of business
- Time intelligence does not work if the model does not contain a dedicated Date table with all the dates supplied from the 1st of January to the 31st of December.
- You can filter multiple fact tables simultaneously (through dimensions)
- Advanced DAX measures might produce wrong results if used without dimensions.
Let’s explain the 4th point (the 3rd one will be explained in the Time intelligence chapter).
We will introduce another fact table, called Targets. Table “Targets” is on the granularity of product, date, and customer. This makes it an ideal candidate to connect to our already existing dimensions. This way we can filter both tables with filters coming from dimension tables.
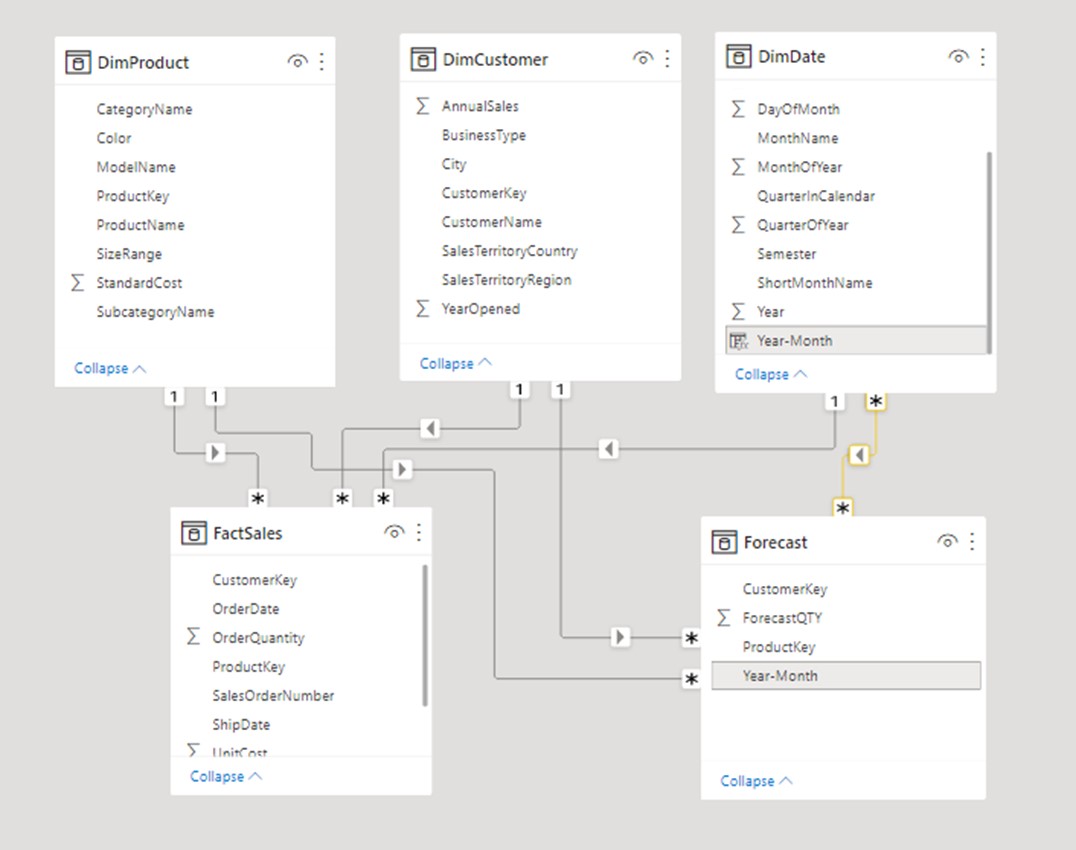
Columns from dimensions DimProduct, DimCustomer and DimDate can simultaneously filter both FactSales and Forecast tables. Prerequisite for dimension being able to filter fact tables is to have an active relationship formed between those tables. When plotting columns on visuals, you should always use columns coming from dimension tables.
We could try to merge data from Targets into FactSales, but since sales are on the Year-Month granularity in the Forecast table (as opposed to days granularity in the FactSales table), this would pose a modeling challenge on how to merge the data in a correct way.
If we observe the relationship between DimDate and Forecast table, we can see that it is a type of many-many. We should tend to use M2M relationships as few as possible, and only in case we have a full understanding of its possible implications on the calculations. Since we brought up relationships, let’s start this topic with an explanation of the types of relationships we can use in a model.


