


When first getting acquainted with DAX and modeling, it’s confusing when to create calculation logic in a Calculated Column and when to use Measures. Quite often novice users try to push all calculations to Calculated Columns, then drag them to the Values field of the visual (making an implicit Measure) or performing a simple Explicit measure (e.g. SUM(CalculatedColumn)) just to return the value back to the visual. This approach is fundamentally wrong. Calculation logic should almost always be implemented in a Measure, and calculated columns should be used only as a last resort and mostly in case of creating static Filter types of columns. We will try to explain best practices with the following example of calculating Gross Margin % in our Sales table.
Calculated Columns Approach
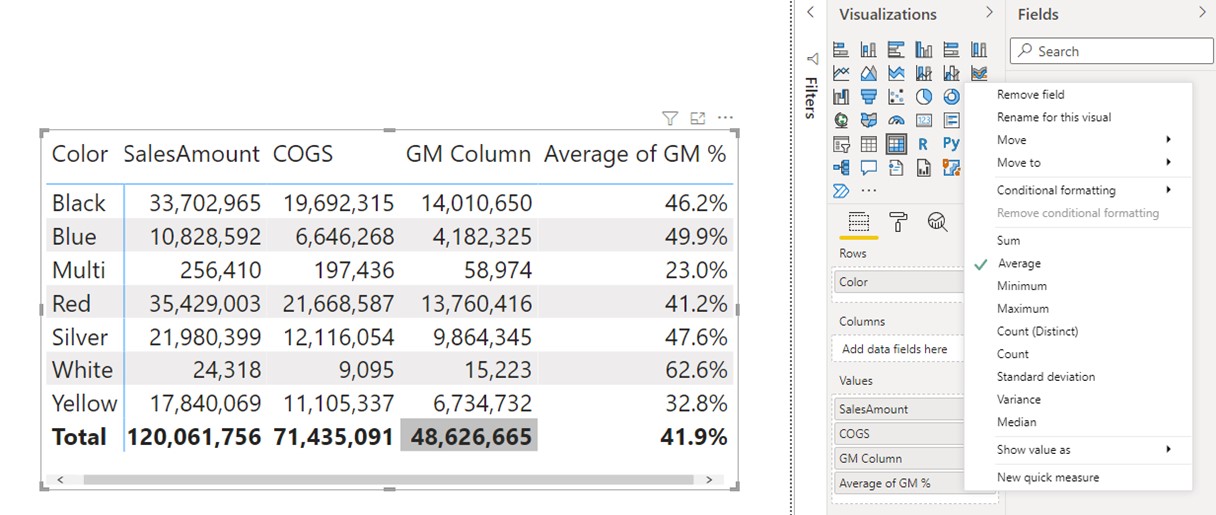
First, we calculated all the figures using only calculated columns.
SalesAmount = Sales[Price]*Sales[QTY]
COGS = Sales[QTY]*Sales[Cost]
GM Column = Sales[SalesAmount]-Sales[COGS]
GM % = DIVIDE(Sales[GM Column],Sales[SalesAmount])
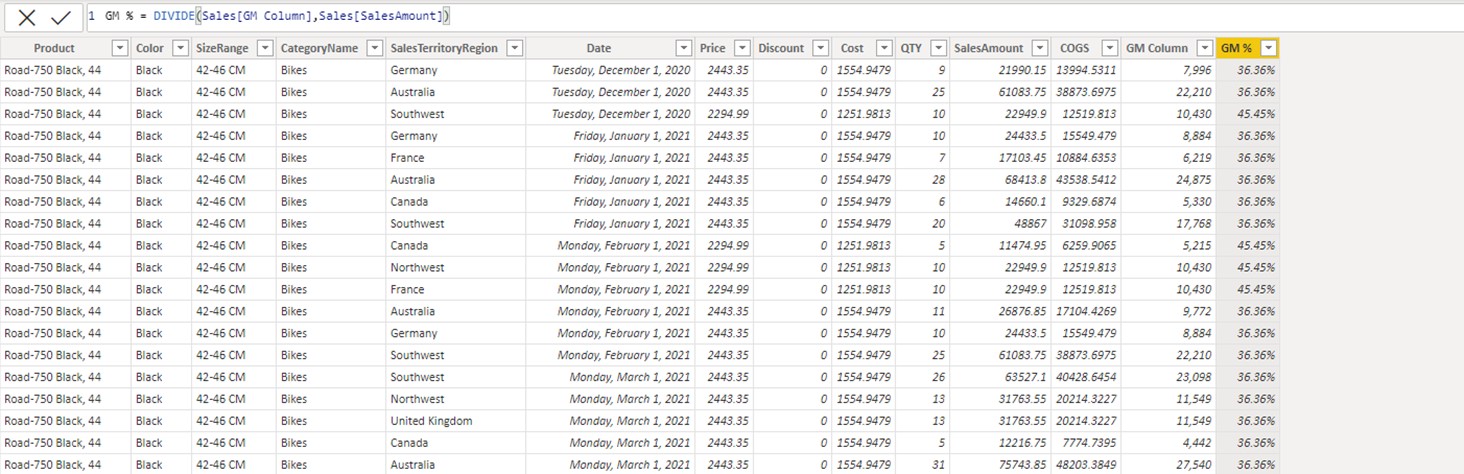
Since we operate in a row context, for each row of the table the calculations return correct figures. But the idea of Power BI/Excel is to present the figures in a visual. We might try to add those columns to the Matrix visual and create implicit Measures.
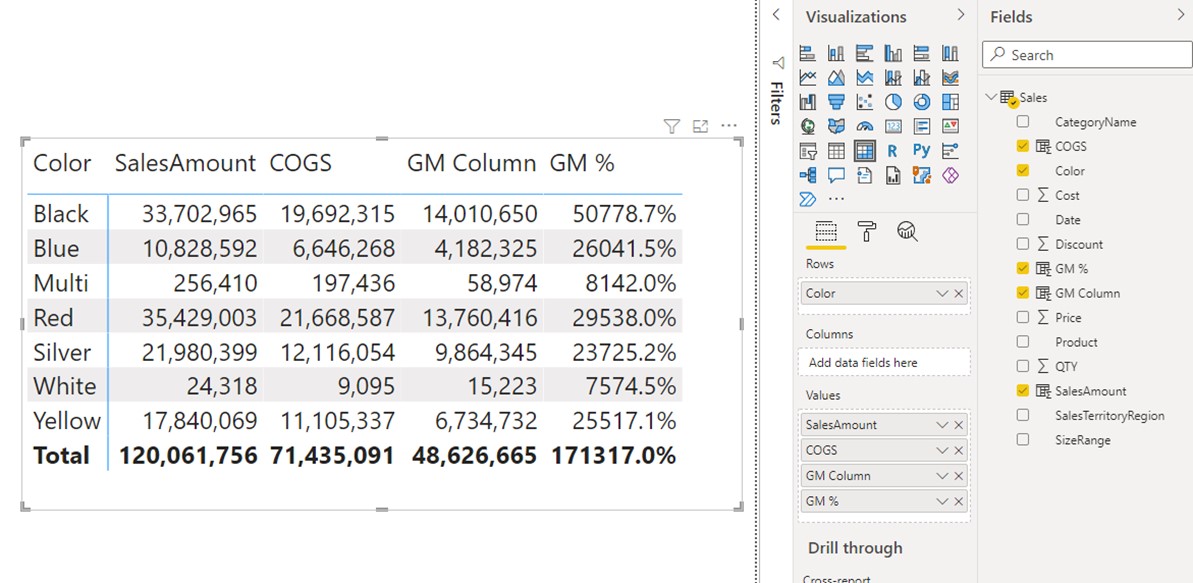
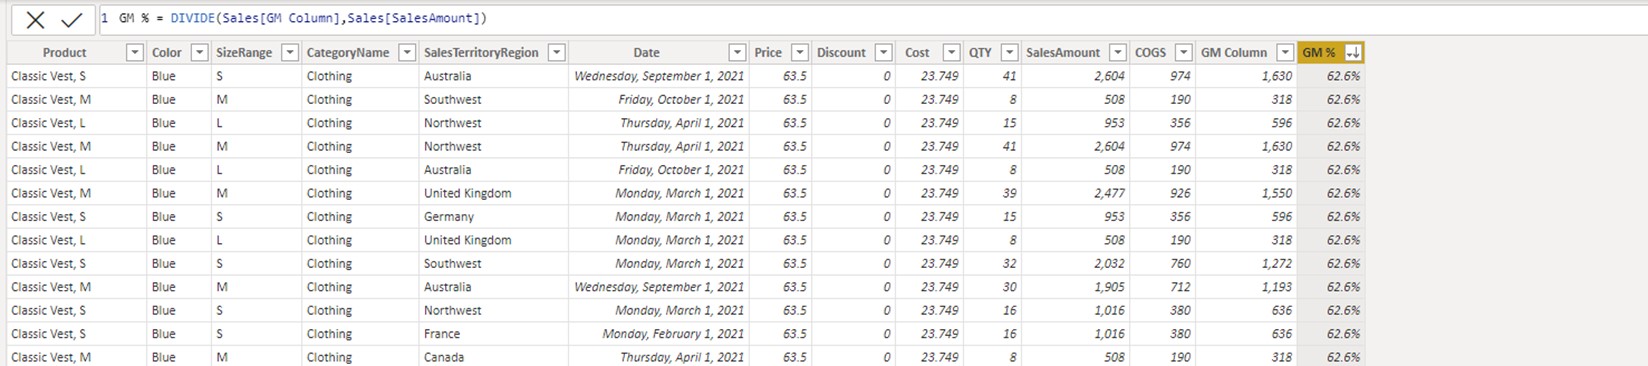
Although [SalesAmount], [COGS] and [GM Column] implicit Measures seem to return the right figures, the GM % is obviously wrong. We know as a fact that GM% cannot be above 62.6%, as seen if we sort the GM% column descending.
The GM% should fall somewhere under 62.6% and cannot be above the mentioned figure. The problem is that we created an implicit measure using the Value column [GM%]. When creating implicit measures with Value columns, the default aggregation of the data is SUM.
If we focus on the first row in the visual, which is filtered by the “Black” color, the following occurred.
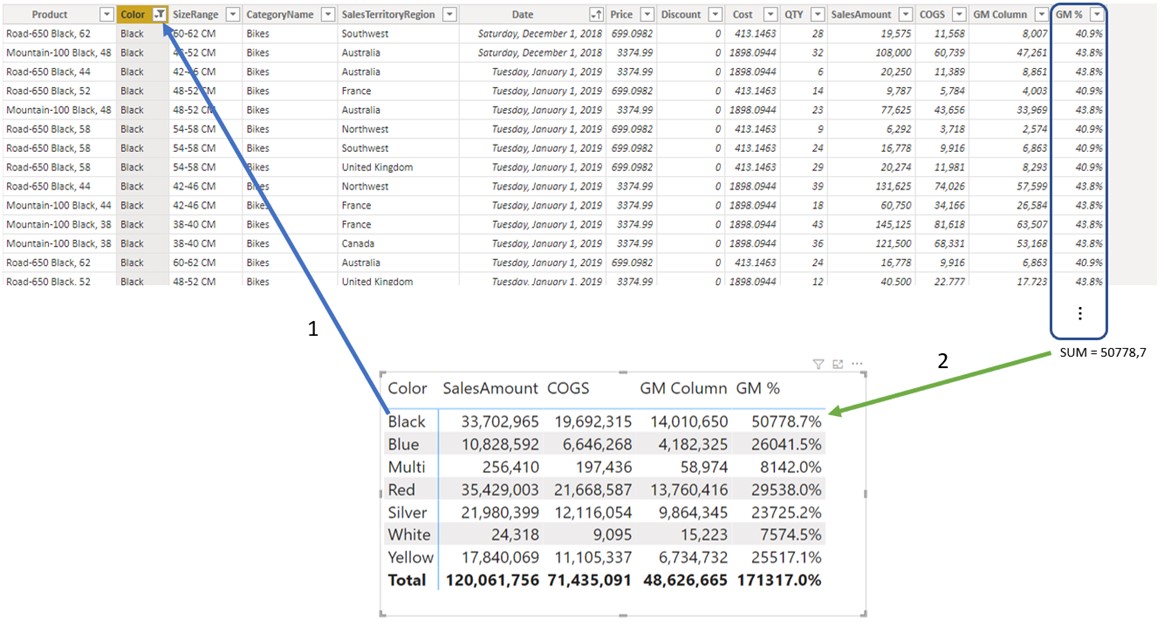
- Original filter context filtered the Sales table so that only Black products survive.
- After the original context has filtered the Sales table, the Implicit calculation kicks in and sums all the values in the GM% column which survived the filtering.
- That value is returned under the Black color field in a Visual.
The issue is obvious. Even though the GM% is correct for each row in the table, it is completely wrong when used in Visual, or to be precise, in the filter context. You might try to change the aggregation type of the implicit measure to Average, but this again is not the correct number since this number is a non-pondered average.
Measures Approach
The only logical way to present the correct GM% result would be to use an Explicit measure. If we observe the row in a visual filtered by the “Black” color, the correct GM% would be the division of numbers 14.010.650 and 33.702.965 which equals 41.6%, not 46.2% as with the non-pondered average.
Now let’s see how to create a Measure that always returns the correct GM% under any filter context.
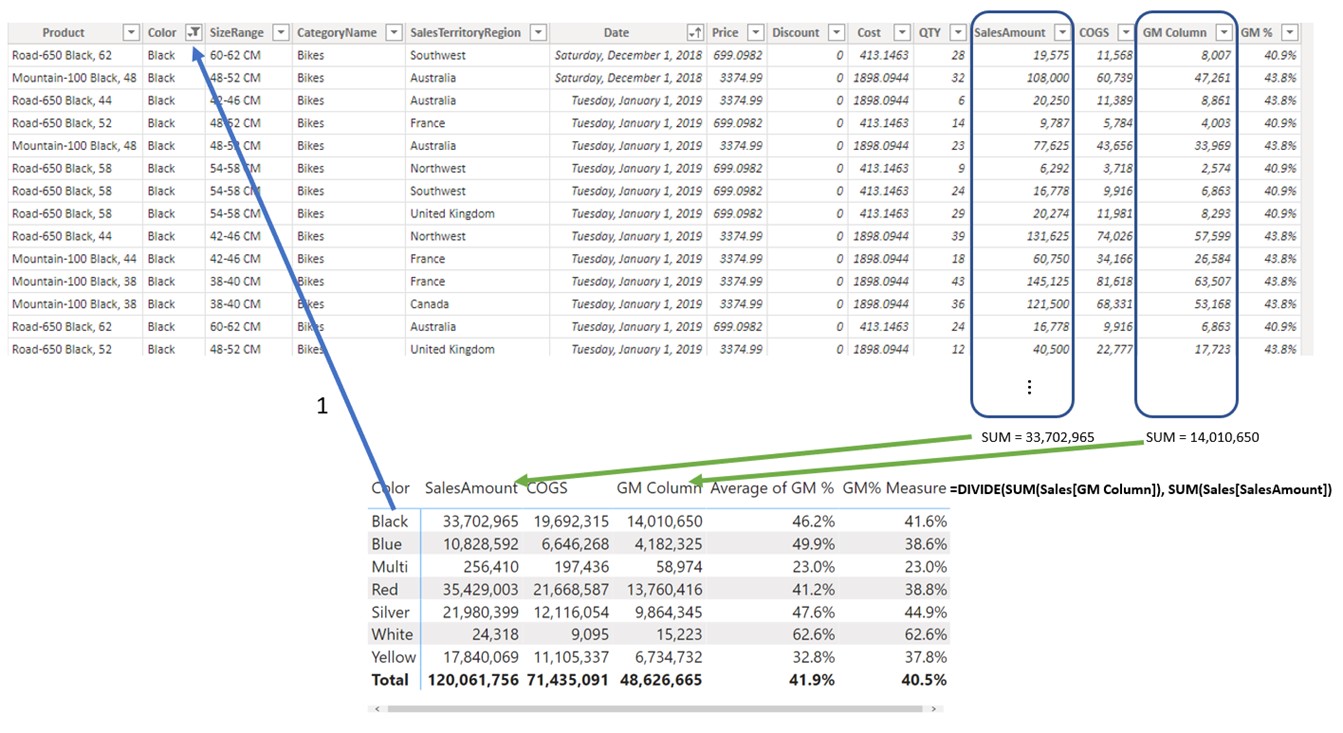
- Original filter context filtered the Sales table so that only Black products survive.
- After the table is filtered by the original filter context, we need to divide the sum of [SalesAmount] column with the sum of [GM column] column. We have to use the SUM aggregation function to sum values of multiple rows in a single, scalar value that can be represented in a visual.
- To return the correct GM% in a visual we need to use an explicit measure with the formula DIVIDE(SUM(Sales[GM Column]),SUM(Sales[SalesAmount]). In our model, we named that measure [GM% Measure].
We used 2 Calculated Columns in creating the [GM% Measure] measure. As we’ve already learned, we should only add a calculated column to a model as a last resort. In all other situations, we should lean towards Measures.
Can we use Measures to produce SalesAmount? If we observe the SalesAmount calculated column, we can see that it is operating in a row-by-row calculation mode (row context). Until now all Measures we used operated in a filter context, aggregating multiple rows in a single scalar value. If we try adding a Measure with the same formula as in the Calculated column, we will receive the error message.

If we try to add the SUM function to force scalar value, the figures are again not correct.
Measure SalesAmount = SUM(Sales[Price])*SUM(Sales[QTY])
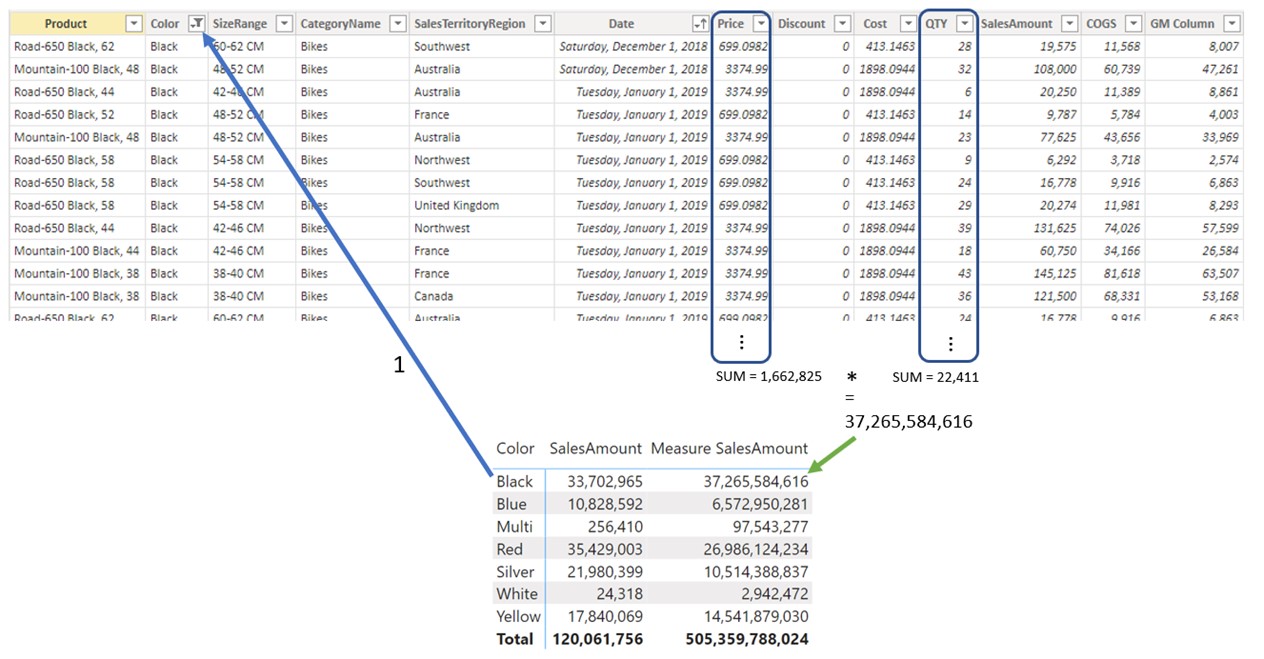
We are now multiplying a sum of Price column with the sum of QTY column, which gives us a huge incorrect number.
To return a correct SalesAmount, we need to use a Measure that can introduce row-by-row calculation, then SUM the result of the iteration. There is a special type of DAX functions for that purpose, called iterative functions. We will explore them in the following chapter.


