


What are DAX Table Functions?
Up until now, we used only functions which return scalar values. What is a scalar value? That is a value that can be represented in a single point in a visual. Measures can only return scalar values. If you try to return a table or column with a measure, you will receive an error. But that doesn’t mean you cannot use table functions in measures.
Table functions cannot be used as the final result in a visual, unless in a specific situation where the table contains only a single column and row, therefore is automatically transformed into a scalar. But they play an important role in creating intermediate steps for most calculations. They are especially important for the proper use of the CALCULATE function. That’s why you should try to understand the most important concepts explained in this chapter, even though you might not see the real application for them in your calculations.
Table Function Types
There are 3 most used types of Table functions.
- Grouping functions: the family of ALL functions (ALL, ALLSELECTED, ALLEXCEPT, …), VALUES, CROSSJOIN, …
- Iterative Functions: FILTER, ADDCOLUMNS, SELECTCOLUMNS, …
- Mixed Functions: SUMMARIZE, GROUPBY, TOPN, …
This is not a general type of Table functions breakdown, but we find it most suitable for explaining the topic.
DAX Studio
Results of table functions cannot be shown directly in a visual. Because table functions mostly return more than one row/column as result, you need to use an external tools which can query the data model and return table structures. The most widely used tool for querying data models is DAX Studio.
Once you install it, you can use it to connect to the model and write DAX expressions that return tables.
You will use DAX Studio for the following purposes:
- Querying the data model;
- Exporting data from the data model to csv, SQL tables;
- Optimizing measures speed;
- Advanced data modeling.
DAX Studio is extremely versatile and robust tool used mostly for advanced measure modeling and measures optimization (Query Plan, Server Timings), but that topics are out of scope of this chapter.
We will explain only the basics of how to query the data model:
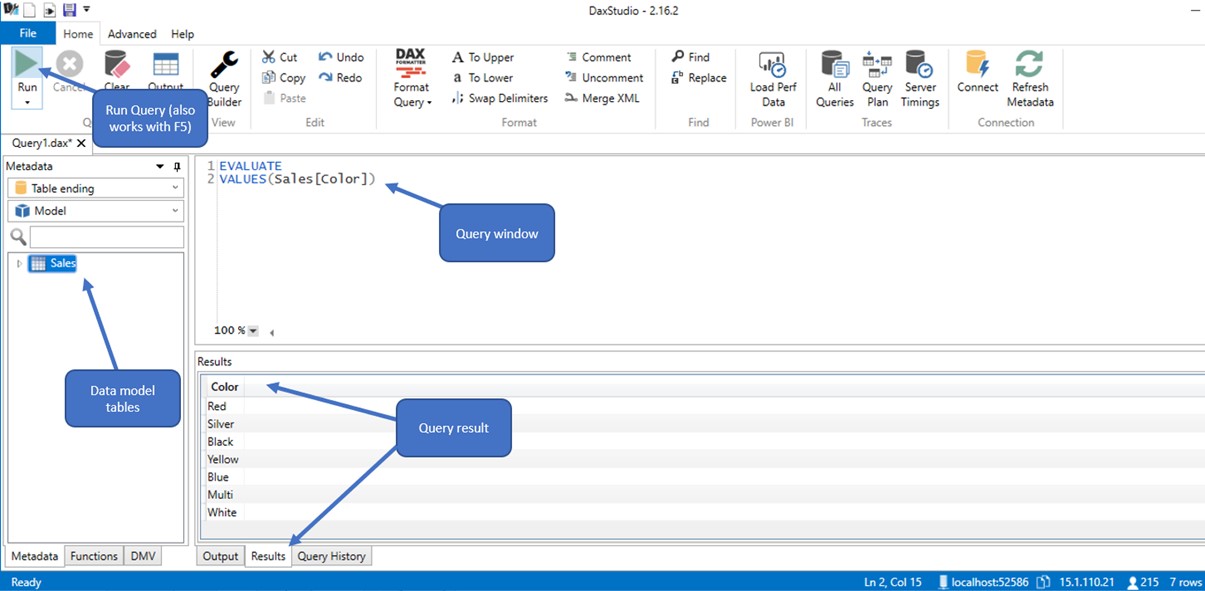
In the left pane you can see all the tables currently present in your data model (currently we have only one table called Sales)
- We can write queries to retrieve data from the Sales table using the middle window.
- EVALUATE is the required keyword that signals the start of the query.
- After EVALUATE we need to write an expression that returns the table. In the picture above, we used VALUES function to return the distinct list of all colors from Sales[Color] column. The result of the query is shown below the Query window.
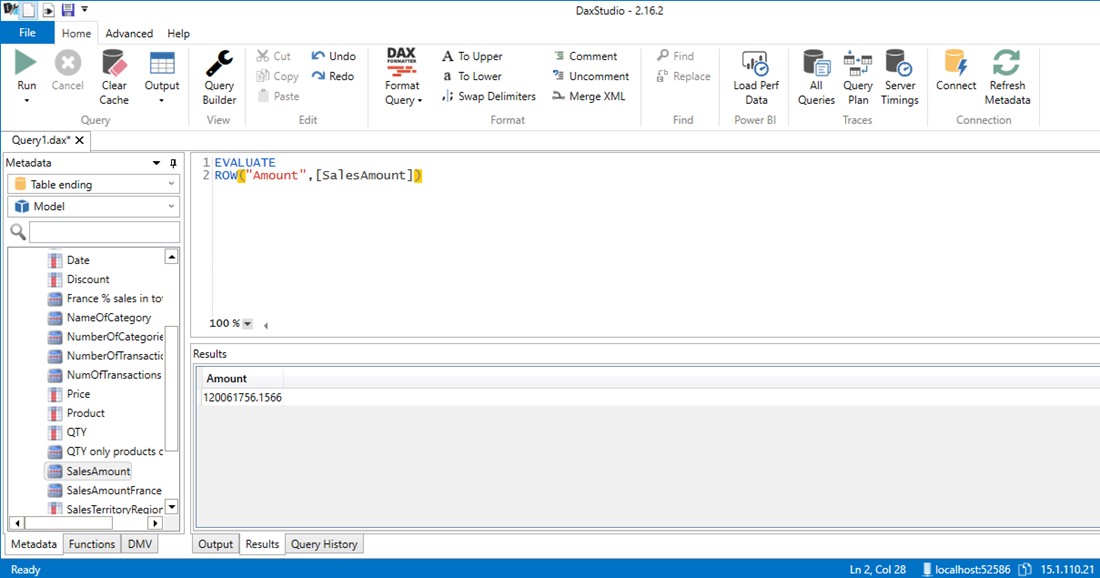
Since DAX Studio is used to return table structures from the data model, it cannot directly return the result of a measure. Instead, we must add ROW(“Column”, [Measure]) syntax.
Simulating Filter Context in DAX Studio
There is no filter context inside of a DAX Studio. If you need to simulate filter context, the easiest way is to use the CALCULATETABLE function.
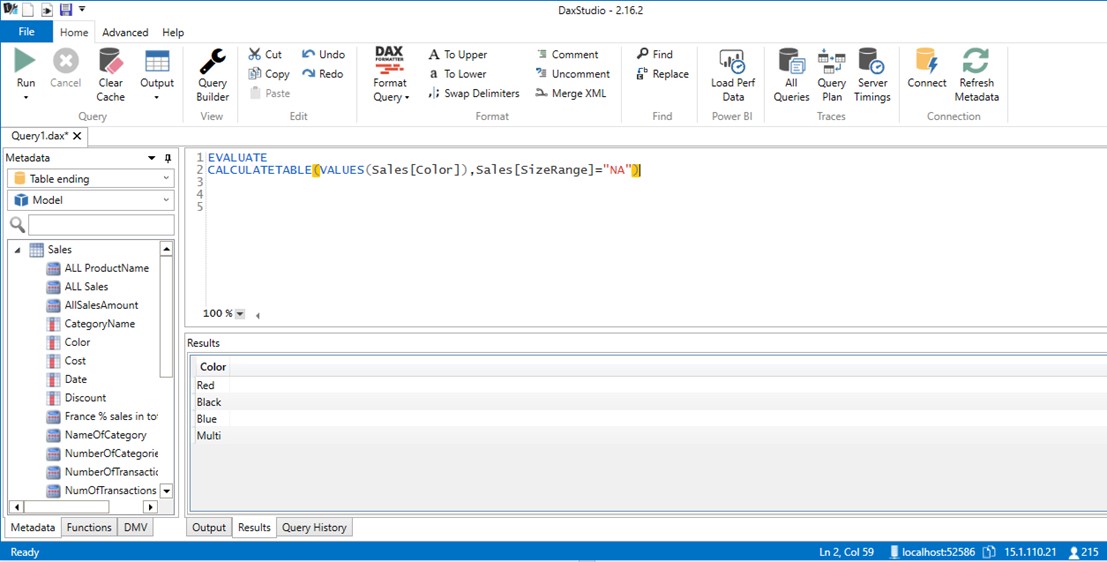
Here we returned the list of available colors under filter context Sales[SizeRange]=”NA”. There are only 4 different colors with “NA” SizeRange.
We used VALUES function to show how DAX Studio can return tables. In the next article, we will explain the difference between VALUES and ALL functions, which are one of the most widely used grouping table functions.


