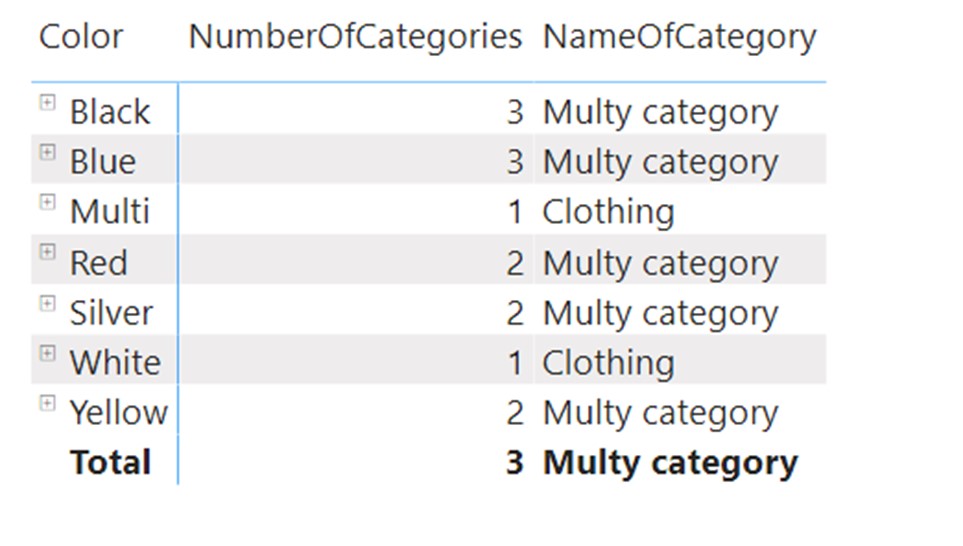
Explanation
All table functions have one special feature. If the result of the table function returns exactly one row and a single column, its result is automatically transformed into a scalar which can be shown in a visual.

NumberOfCategories = COUNTROWS(VALUES(Sales[CategoryName]))
NameOfCategory = IF(COUNTROWS(VALUES(Sales[CategoryName]))=1,VALUES(Sales[CategoryName]),"Multi category")
The [NumberOfCategories] is a measure that counts the number of unique CategoryNames from the Sales table, taking into account the Color filter on the visual. We can see that Multi and White colors have only one type of CategoryName. VALUES function used a single column as an argument, and that column, when filtered by colors Multi and White, returns only a single row. When a table function returns only one row and one column, its result is automatically transformed into a scalar which can be represented in a visual. That’s why we receive “Clothing” text as a result of a measure for the mentioned colors.
Important
When using this technique, it’s extremely important to always secure the Measure to perform scalar transformation only in case the 1 row 1 column rule is secured. In our case, we implemented an IF condition, which counts the number of rows in a table that the VALUES function returns. If count does not equal to 1, then the text returned in a visual is “Multi category”. If the value equals 1, it means it’s safe to make table to scalar transformation and we simply return the result of the VALUES function.
Table to scalar transformation occurs for every table function which, after evaluation, returns a single row and a single column.
[NameOfCategory] measure can be also written with a sugar syntax function SELECTEDVALUE(ColumnName, “Alternate Result”).


