
High cardinality columns are often the problematic part of the data modeling in most environments, including PowerBI.
Since the PowerBI data model resides on a columnar database, having high cardinality columns impact both performance and the size of the model. This is especially the case with columns having more than 2 millions of distinct values. These columns can occupy almost half of the data model size and are hard to compute fast DAX code against them.
There are certain techniques to decrease the column cardinality. The most known are:
- Rounding (numeric columns),
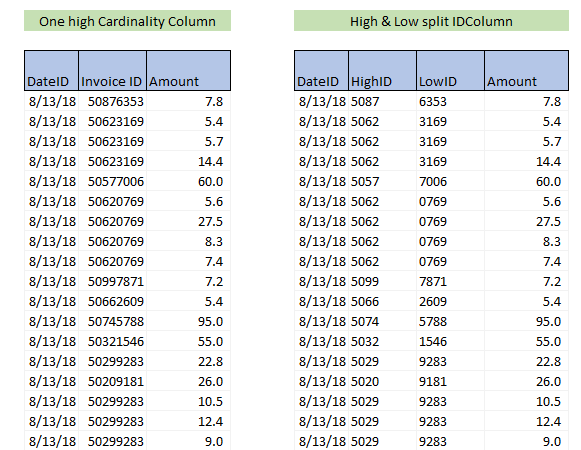
- Splitting columns in low and high ID number (numeric columns),
- Splitting based on char length (text columns).
All these techniques work well when the resulting measure needs to compute additive functions. But at the same time, they all fall short in case of non-additive ones, like the DISTINCTCOUNT.
In order to compute the distinct count of the column, basically, we have 2 options.
- Leave the high cardinality column as is (meaning having a high increase in the data model and .pbix size, which leads to an overall degradation of the model performance),
- Use one of the above-mentioned techniques for decreasing columns cardinality – this will for sure reduce the size of the data model and increase its overall performance, but at the same time, it will drastically decrease the performance of the DISTINCTCOUNT function over the split columns. Why? Because if we want to count the distinct values of the split columns, we must combine them in one column at the query time, which leads to large materialization happening every time we interact with a report. Queries with large materialization have a high impact on query speed which results in slow calculations. The formula needed to accomplish that is not hard to write. But its performance on our model was critically slow.
DistincCountSlow =
COUNTROWS ( SUMMARIZE ( table, table[LowID], table[highID] ) )
It resulted in 4 times slower execution speed compared to
DistincCount=DISTINCTCOUNT(table[InvoiceID])
In our test model with 22 mil rows in fact table, this led to the execution time of SUMMARIZE version to over 12sec. We estimate our full model will be around 80 mil rows, meaning execution time should increase to around 45 sec, which was unacceptable. On the other hand, if we were to go forward with keeping the high distinct values column as is w/o decreasing its cardinality (in the test model it had 7.5mil distinct values, so we estimated that the full model will have around 30mil), we were faced with the issue of the upload limit of the PowerBI dataset, alongside with the whole degradation of the model performance. DISTINCTCOUNT(table[InvoiceID]) is an important metric for our report, so removing it completely was also not an option. We were basically in the dead street. Until we tried the following technique.
OPTIMIZATION TECHNIQUE
Defining the problem
We were dealing with a high number of invoiceIDs generated for each new purchase. We were receiving around 100.000 invoices per day, with multiple items per invoice, each in a separate row (meaning we couldn’t simply use COUNTROWS function over the fact table).
Solution
The approach was simple. We needed to decrease the cardinality of the ID column, but at the same time avoid the expensive SUMMARIZE(table, table[smallID],table[highID]) function over the fact table.
The time granularity of the fact table was set on a day. And we knew for sure that the same InvoiceID can only occur in a one-day timeframe. What we did was, instead of letting each new purchase produce new ID (which led to >30 million of distinct values), we set the ID number to reset each day, starting from 0. This led to a decrease in the number of distinct values in ID column from 7.5 million to around 100k (max number of purchases in one day). The reduction of distinct values in the ID column resulted in a decrease of the whole model size by more than 30%!

How to use this technique to get the right number of distinct values?
DISTINCTCOUNT of the new ID column will produce a wrong result since we are repeating the same IDs for each day. But if we create an iteration over each day, calculating a distinct for each day separately, and then summing that values at the end, we will get the right number.
What we need is a SUMX function over date, with DISTINCTCOUNT for each date.
The calculation is as follows:
DistinctCountNew =
SUMX (
    VALUES ( fact[date] ),
    CALCULATE ( DISTINCTCOUNT ( [fact[NewInvoiceID] ) )
)
We thought that the performance of the calculation would be slow, but that was not the case. There is an iteration over the date’s column, but in the case of 2 years of historical data, that is only 730 iterations. For VertiPaq(95% of the calculation time is done in it), that is nothing. On the other hand, in each iteration, we are doing a distinct of maximum 100.000 values, which is considerably smaller than 30 million values in the case of DISTINCTCOUNT(fact[InvoiceID]).
We tested both techniques, and the results on our model were astonishing. We managed to reduce the .pbix file size from 219mb to 122 MB, at the same time reducing the data model (based on VERTIPAQ analyzer) by 32%. We didn’t have to sacrifice any performance for DISTINCTCOUNT and even got better performance on trended data, while we increased overall model performance by around 18%.

Requirements for this technique
- ID column can only be used for DISTINCTCOUNT calculation. If you need this column to be a key column, or you wish to create other calculations besides distinct, that will not be possible with this approach.
- You will need a column on which you will be able to reset ID values for ID column (column needs to be the one for which, for each value in the column, only unique ID can occur). For our purpose the TimeID column was perfect.
- You will need to test this approach on a different combination of columns to get optimal performance under a different set of filters.
Hope this technique will help you all struggling with the high number of the distinct values in the fact tables. In our model, it resulted in a high decrease in model size and increase in the speed of the model(and also DISTINCT calculation). I cannot testify that this technique is suitable for all data models, you will have to test it to see how and if it fits in your data model.


