This is the second part of the blog series dedicated to showing workarounds for currently unsupported matrix visual features. In the first part, we explained how to add conditional formatting only for the specified columns. In this article, we will explain how to introduce sorting.
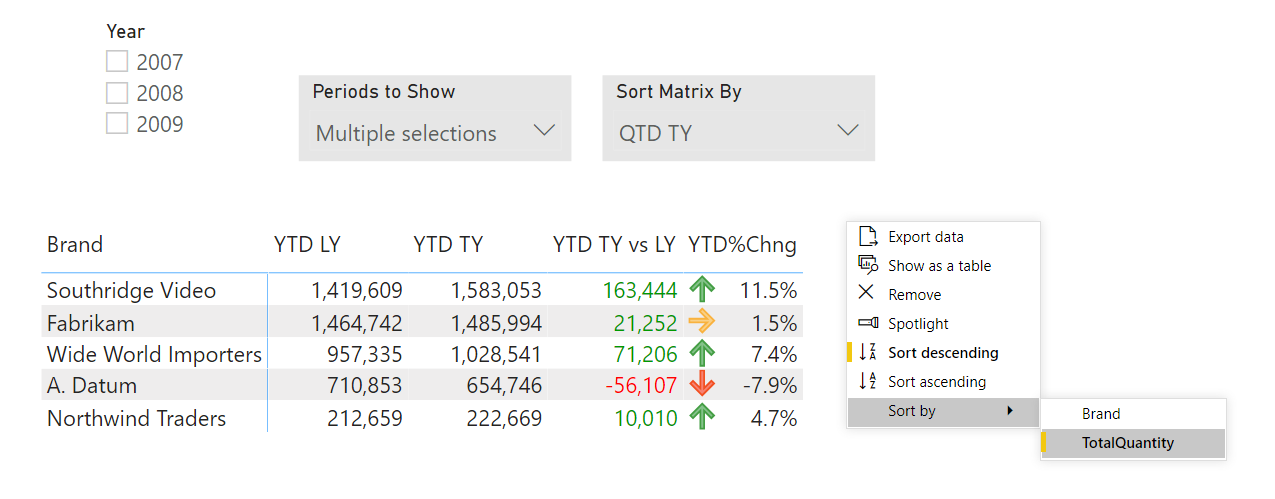
Below, you can test a working example in the embedded report, and if you wish to follow along, you can download the .pbix file here.
Data Model Preparation
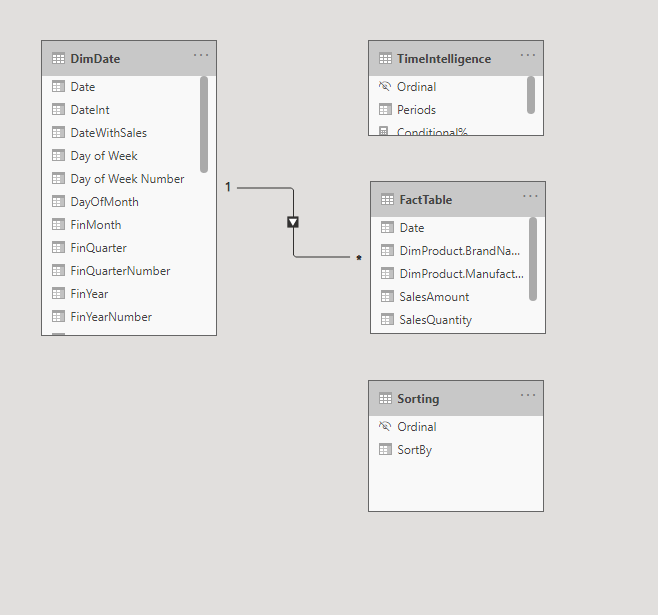
The data model is a simple one, consisting of a fact table connected with the date dimension, and 2 disconnected calculation group tables. The first calculation group is holding TimeIntelligence calculations while the other one will be used to introduce sorting.
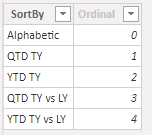
The Sorting table looks like this:
For the TimeIntelligence group, we used the usual time intelligence functions and we set the precedence of the group to 0.
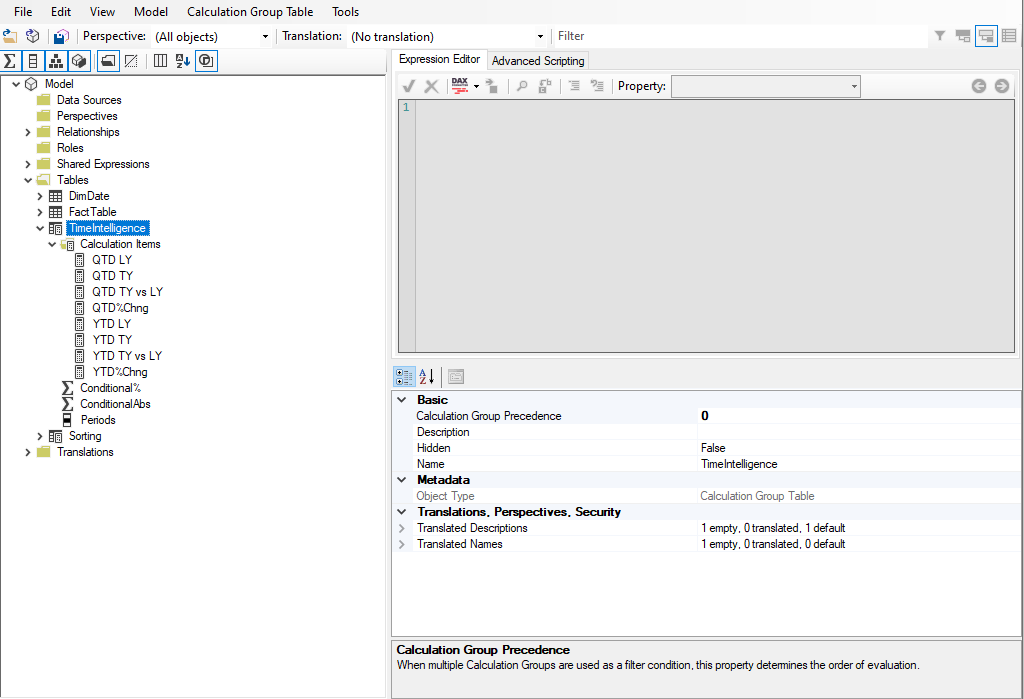
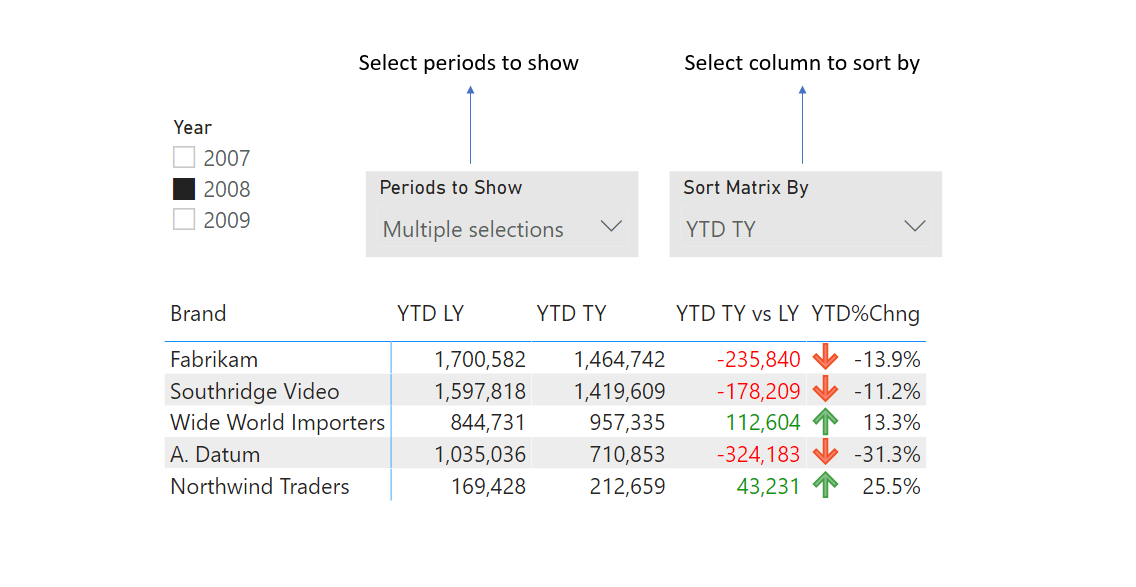
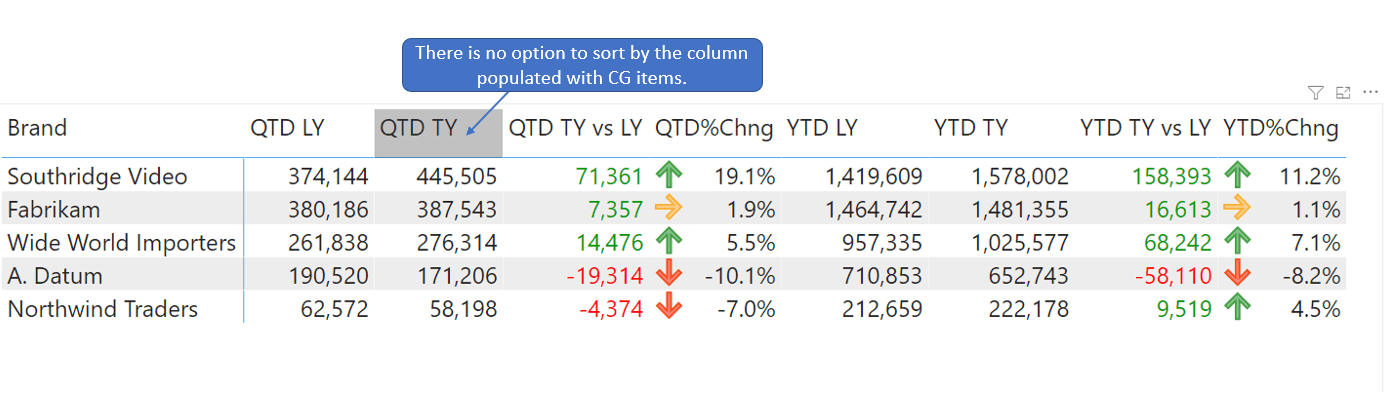
When we add the calculation group to the matrix visual, there is no option of sorting by calculation item.
Following is the workaround using an additional Calculation group that will be used as a sorting generator.
The solution does pose a certain performance implication and slows your Matrix by an additional ~30% of regular speed.
Total Fields as Container for Sort
Since it is currently impossible to introduce sorting on the Matrix column created with a calculation group, we will take advantage of the Total column and use it as a container for the sorting measure. Although in the current version of PowerBI it is not possible to show column subtotal if we are using calculation groups, the total is there.
The problem is that the Column total is completely useless if applied on top of multiple Calculation Items, and it is acting unpredictably (I guess that’s the reason why they removed it from the show option), but it is definitely there, hidden.
Solution Using Additional Calculation Group
We will use this hidden total to inject sorting options. For that purpose, we will use the Sorting calculation group.
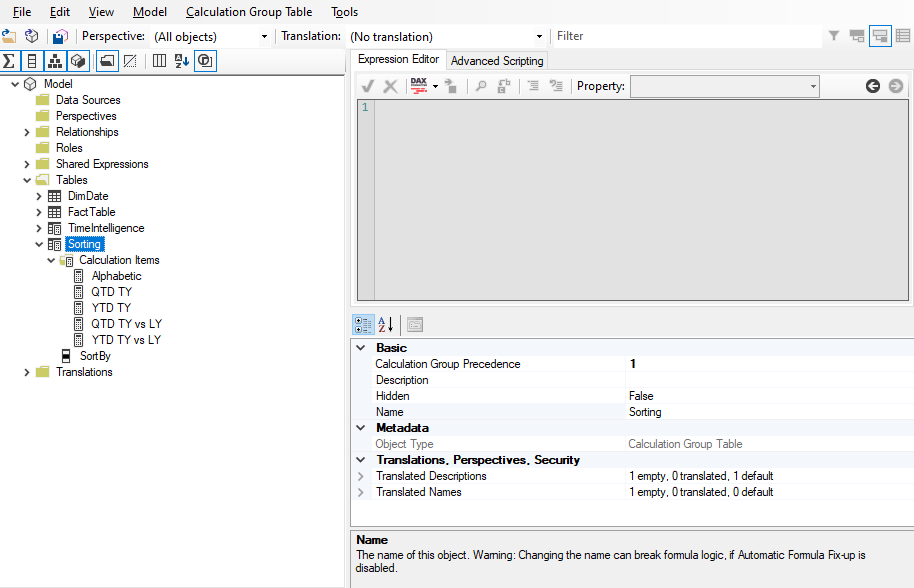
In it, we need to add all the sorting options that we want to apply to our matrix. In our case, those are the 5 calculation items listed in the picture above. We can set the precedence of this calculation group to a higher number than 0.
Now the tricky part, we need to provide the Sorting calculation item measure only to the matrix Total column and ignore other item fields. For that purpose, we will add a checking part code to each Sorting Calculation item. Below is the example with the YTD TY calculation item.
YTD TY =
IF (
    ISFILTERED ( TimeIntelligence[Ordinal] ),
    SELECTEDMEASURE (),
    CALCULATE ( SELECTEDMEASURE (), DATESYTD ( DimDate[Date] ) )
)

The bold part needs to be added in each Sorting calculation Item so that it only applies sorting measure to the calculation group total while ignoring other columns. In case we omit this rule, we would introduce ambiguity therefore precedence will kick in and potentially mess up the calculations. The final part of the calculation item is the YTD measure that we want to show in the Total column when the checking condition evaluates to false.
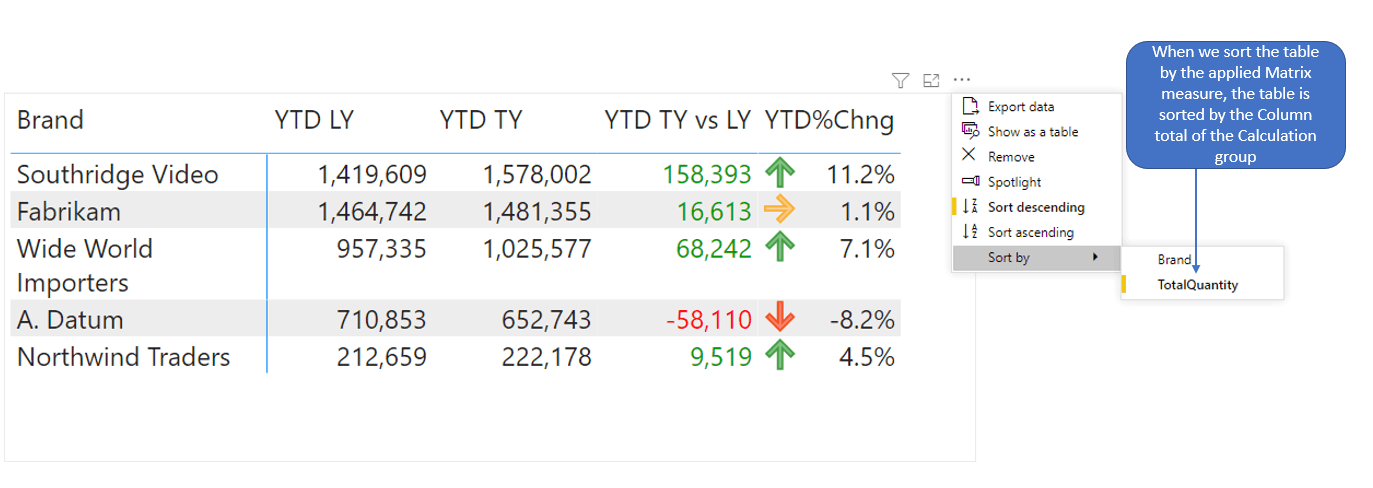
The picture above shows more details of what we are trying to achieve. When sorting the matrix visual that has its columns populated, it is only possible to sort by the Total column.
But when we populate the matrix visual column field with a calculation group, the Total column makes no sense at all since it is the total of all the calculation group items. On the other hand, it does make sense if it is populated by a specific calculation item or dedicated measure. In the picture above, we used a YTD TY calculation item from the Sorting calculation group to change the Total column so that it shows YTD TY values (non selected part of the formula above).
We have to push both selected TimeIntelligence period and Sorting calculations to the calculation group, and in this case, precedence doesn’t really matter, maybe only in terms of performance. This is what is actually happening in the QTD TY measure if we nest calculation items (YTD TY is chosen for the sorting).
CalcItem Measure =
IF (
    ISFILTERED ( TimeIntelligence[Ordinal] ),
    CALCULATE ( SELECTEDMEASURE (), DATESQTD ( DimDate[Date] ) ), //The measure from TimeIntelligence
    CALCULATE ( SELECTEDMEASURE (), DATESYTD ( DimDate[Date] ) ) // The measure from Sorting
)
The highlighted part is the inner calculation group (TimeIntelligence) item measure. Since in the QTD TY calculation item the ISFILTERED() part of the formula evaluates to true, it will return the QTD TY Measure. The same will apply to each calculation item (matrix column). On the other hand, in the Total column, the formula above would evaluate to false, therefore returning YTD TY period values. We can use that column to create our sorting upon.
Final Fine Touches
The last step we need to do is add both calculation groups to the canvas, and connect them to the matrix visual. Also, don’t forget to sort the matrix by the applied measure!
This topic is also explained in our youtube video posted below!
Hope you enjoyed reading through this article series. In case you have any questions, please post them below!
how in the world can MS not allow sorting on calc groups. They is HUGE LOSS and users HATE not being able to sort. 30% DECREASE in performance by the workaround is LOUSY. SHAME on MS. And there is no road map.
Thank you. In case we use dynamic measures in values (not the one measure) of the calculation group. Can you please guide how to achieve the sorting?
Great solution! what`s inside alphabetical calculation item?
Can you sort by size instead of alpha? I’m using it for percentages and 100 comes after 90.
Alternatively, you can manually set the order by setting the Ordinal property for each Calculation Item via Tabular Editor. This controls the order in which the Calculation Items are sorted in a matrix when the Calculation Group Name column is added to a matrix.
Great solution! Thank you very much.