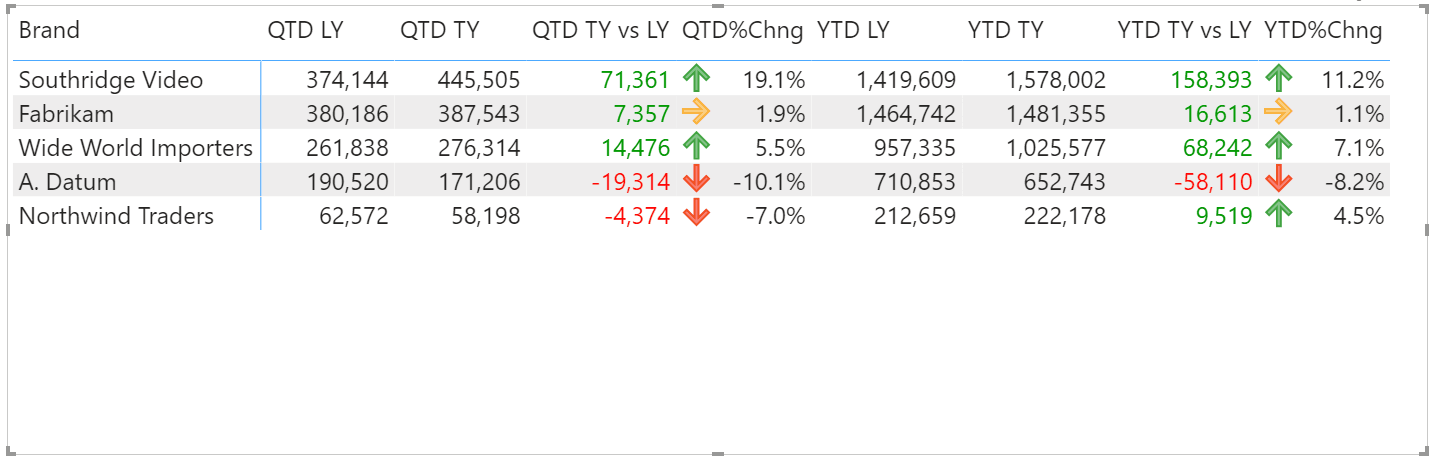
This is going to be the first of 2 articles explaining how to introduce conditional formatting and sorting when using calculation groups in Matrix visual. It would be great if conditional formatting and sorting could be applied to a calculation item, but until this happens, here is a workaround. Link to the second part of series where we explain how to introduce sorting with calculation groups: Link
Below, you can test a working example in the embedded report, and if you wish to follow along, you can download .pbix file here.
If you haven’t started using calculation groups yet, you should! They are the best new feature in the PowerBI data model in years. They make our data modeling lives easier by reproducing the same filter context for any measure we provide as input and act as a “placeholder” for measures.
Calculation groups can be also used for more advanced modeling, but that is out of the scope of this article.
Although great, they currently do have some shortcomings that I hope will be implemented in future releases. One of the features currently missing is the possibility to conditional format a single item from the calculation group. To demonstrate what is missing, I’ve created a simple data model as an extract from Contoso DB.
The Model
The data model consists of 2 tables (DimDate and FactTable), and a single calculation group called TimeIntelligence.
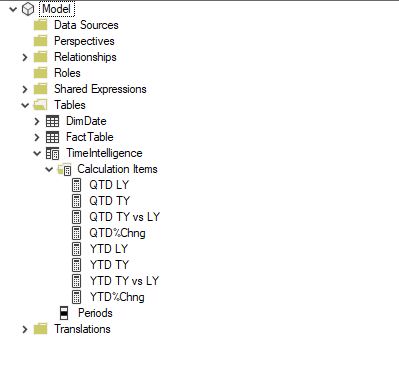
We won’t go into an explanation on how to create calculation groups/items and how to format them since there are many articles and videos already covering those topics. Calculation items were created in the same fashion using the time intelligence patterns from SQLBI guys. You can follow this link to check more about time intelligence patterns. We won’t explain the code of each calculated item since it would take too much effort while these guys already made an awesome job explaining them in detail.
When we invoke the calculation group with all the items onto our PowerBI canvas, we receive the following table. We used Matrix visual for demonstration.
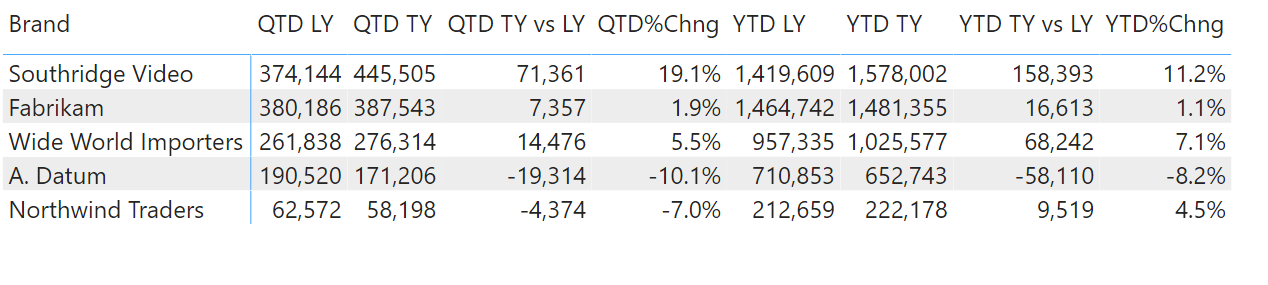
As we can see, it’s pretty hard to distinguish positive from negative absolute and relative changes.
If we want to conditionally format this table, we are stuck with a single value that can be formatted, and that is a Measure used in the calculation.
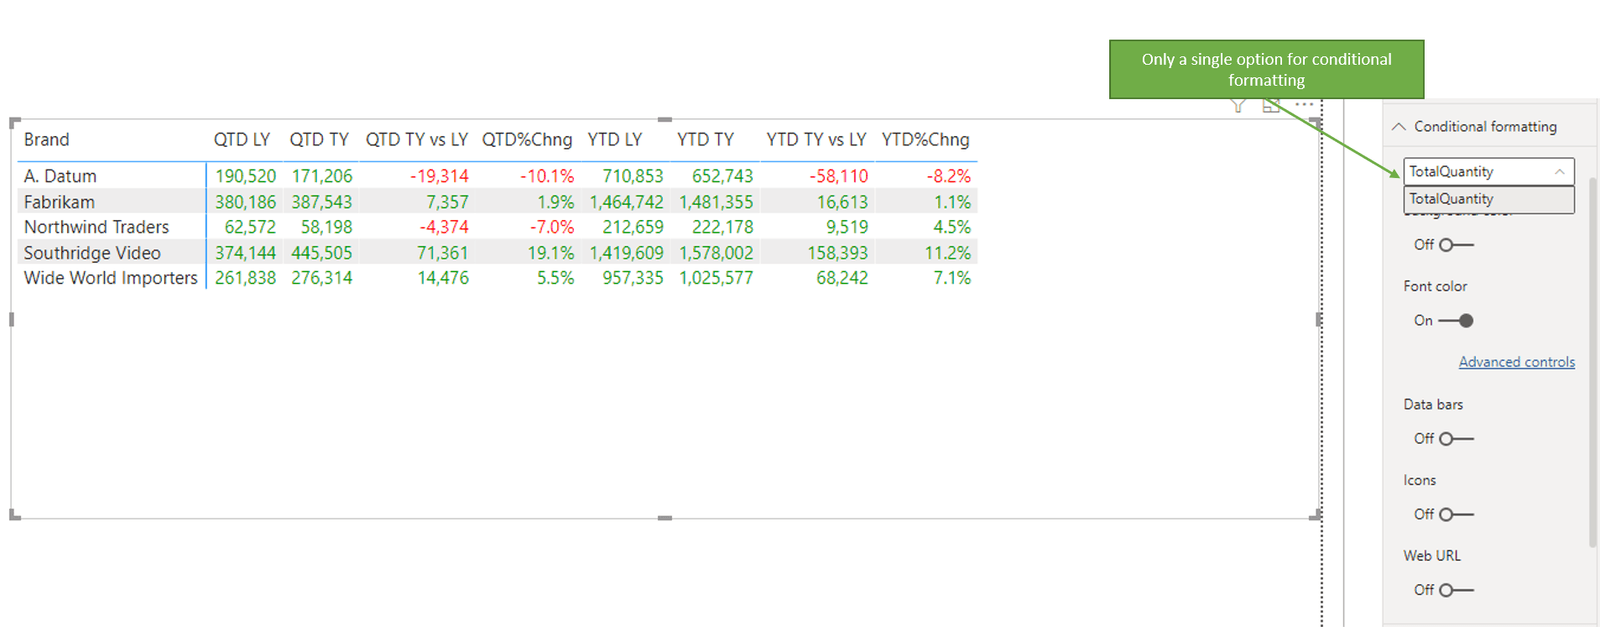
Currently, there is no option to conditionally format just a single CalculationItem (at least I haven’t found one), but there is a trick to simulate that behavior.
Conditional Measures
The trick is to use a dedicated Measure that will be provided as a basis for conditional formatting of the matrix. In that measure, we can define to which columns conditional formatting should apply.
To demonstrate this, we will create 2 additional Measures, called Conditional% and ConditionalAbs.
Conditional% =
IF (
    SELECTEDVALUE ( TimeIntelligence[Periods] ) IN { "QTD%Chng", "YTD%Chng" },
    [TotalQuantity],
    BLANK ()
)
ConditionalAbs =
IF (
    SELECTEDVALUE ( TimeIntelligence[Periods] )
        IN { "QTD TY vs LY", "YTD TY vs LY" },
    [TotalQuantity],
    BLANK ()
)
The idea is to create a measure that shows value only for the calculation items we provide in the curly brackets. For other measures we want them to evaluate to blank, meaning that conditional formatting will ignore them.
Next, we need to go to the conditional formatting options of the Matrix and select to apply those measures as a basis for conditions.
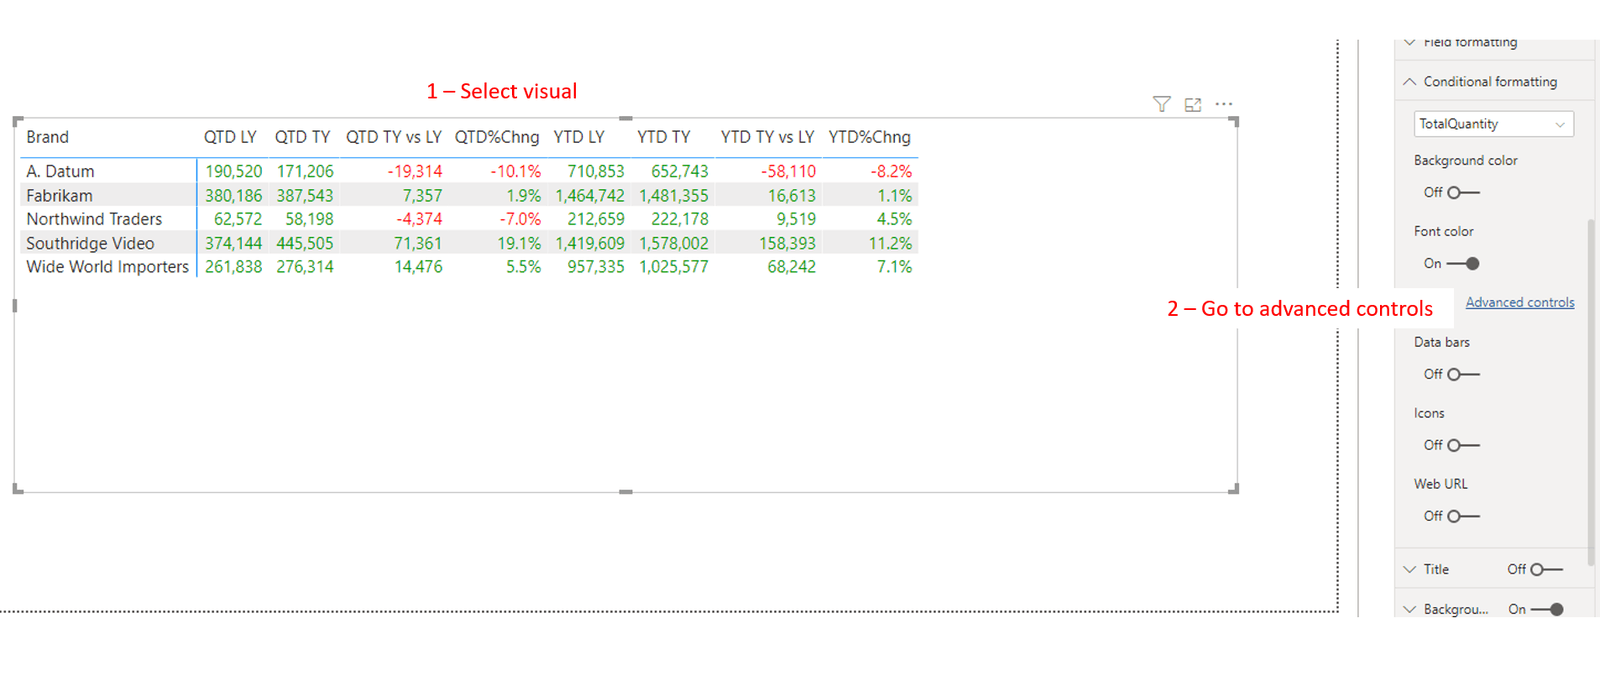
We need to go to the advanced controls of the condition we wish to alter. In the advanced options window, we need to change the “Based on field” value from TotalQuantity measure to our newly created ConditionalAbs Measure.
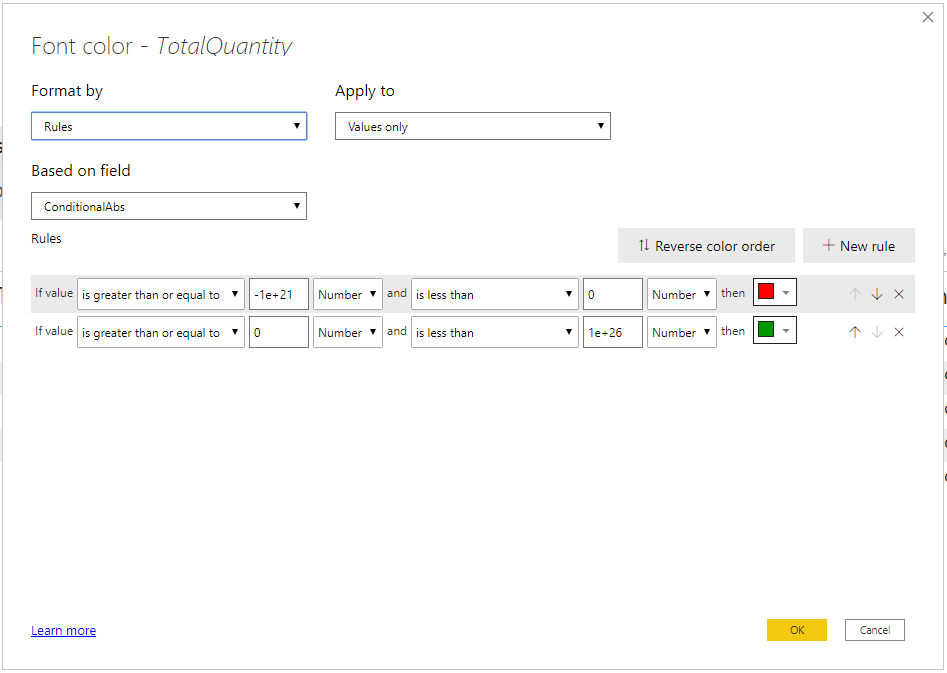
We do the same procedure with the Icons conditional formatting option, but this time we select Conditional% as a base measure.
[](/uploads/CondFormattingCalcItem5.png>
After we confirm, we receive a nicely formatted Matrix.
Bonus Tip
You can use your calculation group column as a filter for the matrix. Conditional formatting is preserved and is being activated when you select those fields in the slicer.
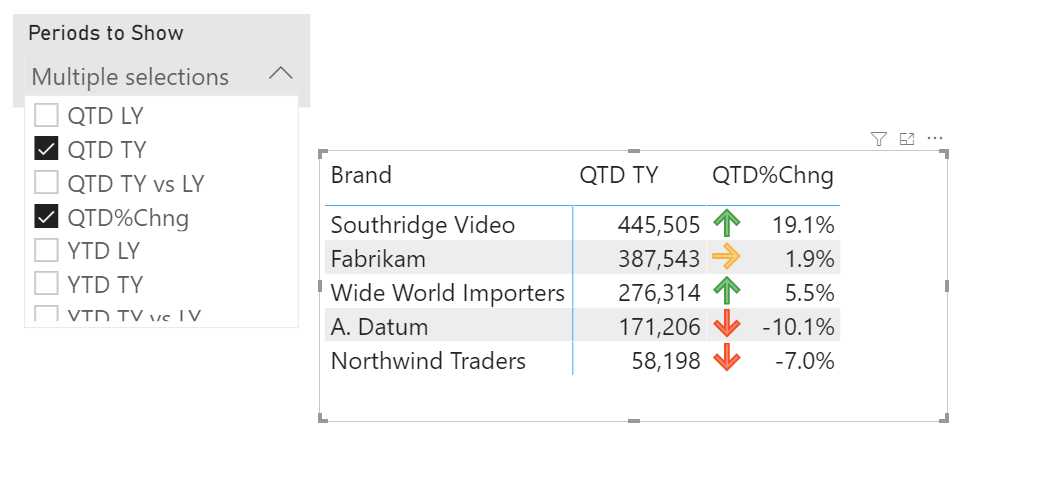
Hope you find this trick useful. We will use a similar technique to create Matrix sorting, which will be shown in the following article.
If you have any questions, please post them below the article.
I wanted the same icons formatting for time intelligence, For all KPIs it should show as expected but only two KPIS for selected measure it should show reverse icon like for positive percentage it should show red and for negative it should show positive. Is it possible with Time intelligence
Thanks for sharing this logic, very useful one. Quick one what if we have multiple attributes in "Values" how do we conditional format in such cases, in the example provided there is only one attribute "[TotalQuantity]" but in my table i got multiple measures like this
Cant get this to work. Selects the 1st 2 calculation items but not any others I try to include in the curly brackets and doesnt apply the correct rules. Just trying to do positive green and negative red and the whole column turns green regardless of value. Using rules and its the only calculation group in the model.
How do you adjust the formulas for a matrix with multiple measures? I tried SELECTEDMEASURE() but that didn't work.
And even with only one measure, the columns still are not highlighted properly.
Hi Will, have you tried with our example .pbix file? In it is the whole code and you can check the logic if you missed any step.
Yes, copying directly from the model. the entire column is highlighting green.
I am unable to get this to work, the conditional formatting keeps applying to all the columns in the matrix.
To the people that were not able to achieve it.. eg. all columns have the conditional formating instead of just the desired one.. beware that if you have other calculation groups interacting with the matrix (for instance another slicer) the measure you created won't work, it will be overridden by that calculation item. In my case, I solved it using the conditional formatting measure and excluding it from the calculation items I didn't want it to interact with using this syntax. Hope it helps.
Hey, would you able to explain what [Cond Format Measure] and calculation item code would be? An example would really help me solve this.
Thank you very much! I got stuck with an interesting issue though. A test measure returning SELECTEDVALUE() gives me the right value with this example calc item:
However as soon as I start making substractions in the calc item (needed for YOY, YOY% and so on) it throws an error, example:
The result should be a number and with "- 0" it should still be a number.. do you understand what's going on or is it a bug?
Hi Johan, the issue is most probably in the interference of items of the calculation group. To debug, try denormalizing all nested items to see where the calculation introduces text values.
Have you found a way to apply the color scaling based on min and max from each column ? Because color scaling is based on min and max across all columns (or all those specified in the selectedvalue() ) If we only need to format one column, it's not an issue, but on multiple columns it won't work :/ This is a bit annoying, I wonder if it couldn't be done using allexcept()
Hi Gregory! This technique currently does not work with color scaling (due to internal replacement of blank values with 0).
Hi, when I do this process, the conditional formatting ends up working for all columns in the matrix and I would like it to work on specific columns. I did exactly like you.
Same for me. Is there a solution on this yet?
No
This can happen if you try to use Format by "color scale" instead of "rules". This feature does not work with color scale since it internally transforms blank values to 0, therefore applying formatting to every cell.
Hi, I used "rule" anyway. I don't know what happened to not work. I wanted to give the condition only to the percentage columns.
To hide or show the columns in the matrix, I use this code. Does it have something to do?
SELECTEDMEASURE() returns measure reference pushed from the visual from within PowerBI. Unless you try to check if that measure reference returns that specific text in the specified filter contexts, then I think you used the wrong measure. It seems you wanted to use SELECTEDMEASURENAME(), which returns the name of the measure reference. If you have more calculation groups (as it seems), then you also have to be aware of the precedence and other more complex dynamics involving having multiple CG impacting the same visual.
This isn't working for me. The "SelectedValue" part of the formula gives an error when the calculation item is doing math. The error is: Cannot convert value 'YoY%' of type Text to type Numeric/Date. How did you get around this?
That would mean you tried to compare time intelligence periods as dates with textual values. Would have to see more of your measure and model to have a more specific answer.
This works a magic, Thanks, is there anyway you can have formatting for sub totals in a metrix visual. image is attached below. Thanks for your help.
Not sure what you mean exactly, could you please share more details?
I am currious, why would this calculation Groups conditional formatting not work for colour scales. I have tried and tried with no luch :( does anyone have any ideas.
It should work, but in case there are negative values then blanks are treated as 0 and will get formatted. In case all values are positive, you can set the minimum to 0 and the color to match font color, that way those values won't get formatted.
Hi, i have an issue, other calculated items get formated !!!
Not sure why, care to share more details?
Hi Krešimir, this is great work and thank you for sharing. Do you know if it is possible to replace the absolute measure reference in the conditional measure with the SELECTEDMEASURE() function ?So instead of Conditional% = IF ( SELECTEDVALUE ( TimeIntelligence[Periods] ) IN { "QTD%Chng", "YTD%Chng" }, [TotalQuantity], BLANK () ) To have Conditional% = IF ( SELECTEDVALUE ( TimeIntelligence[Periods] ) IN { "QTD%Chng", "YTD%Chng" }, SELECTEDMEASURE(), BLANK () ) Thanks Again . Anastasios
I wouldn't say that is a possibility since SELECTEDMEASURE() function can only be used in calculation items.