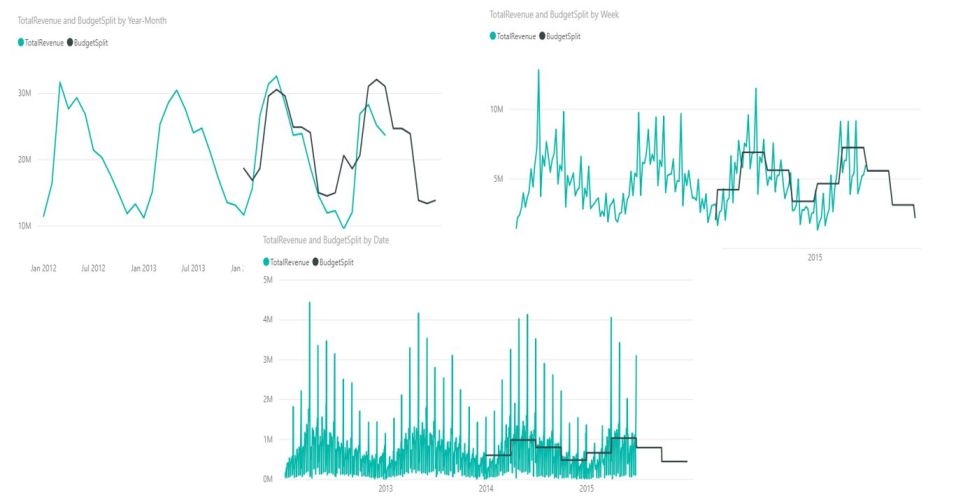
When creating a budgeting prediction, most of the time we are creating it on the higher granularities. Rarely we do it on a daily basis.
But sometimes we are required to match budgets to actual sales on lower granularities than the one we previously set (e.q. the manager wishes to see how would the budget split look like if we were to split it on a daily basis to see which days are above average).
In those scenarios, we have 2 options (if we do not want to manually split budget granularity, which would be a tedious job).
- Split the granularity linearly by the number of days in observed periods,
- Split the granularity based on the actual ratios (we take the previous year sales ratio and apply it to this year budget).
In this post, we will be dealing with the first option, while in the next post we will examine how to perform budget split based on ratios and what to be aware of while implementing calculation.
The model
To start with, we will use the Sales and Marketing sample database from Microsoft. If you wish to follow along, you can download the .PBIX file here.
The data model is a simple one, consisting of 3 dimensions, fact_sales table and a TargetBudget table which is set on a quarterly granularity.

The easiest way to connect a Dim_date table to TargetBudget table, even though they are not on the same granularity (Dim_date is daily while TargetBudget is quarterly), is to put all sales in the TargetBudget table to the first date of that quarter, like in the picture below.

This way we can easily connect the two tables with a 1 to * relationship, and calculations will produce correct results on the yearly/quarterly level. The issue becomes visible when we decide to drill down to lower levels. As we can see in the picture below, when we drill to month, the budget revenue stays at Quarterly level, which makes it hard to compare.

What we would like to see is a linear split of the budget values to monthly level (or any other lower granularity), as represented with the red line!

To accomplish linear split on lower granularities, we need to create a dynamic calculation that will correctly divide quarterly sales into any other lower granularity, while maintaining the correct summed results on all the levels above quarter.
In the rest of the post, we will go through the formula that accomplishes this task and explain its steps. You will also get a clearer view of how to use it in your own models.
The logic behind the formula
If we want the formula to produce a correct result on every granularity, we need to set the TargetBudget granularity to Fact_sales one, which is daily. After that, we need to sum up individual daily sales with the respect of the current filter context (or in simpler terms, based on the currently used granularity of the visual).
We also have to take into consideration that the formula needs to split budget values only when drilled down to lower granularity than Quarterly, while on the higher granularities it needs to provide correctly summed quarter values.
Formula
BudgetSplit =
VAR FirstQTRDate =
    STARTOFQUARTER ( Dim_date[Date] )
VAR LastQTRDate =
    ENDOFQUARTER ( Dim_date[Date] )
VAR BudgetDates =
    DATESBETWEEN ( Dim_date[Date], FirstQTRDate, LastQTRDate )
VAR BudgetToDivide =
    CALCULATE ( [TotalBudget], Dim_date[Date] IN BudgetDates )
VAR NumOfDays =
    COUNTROWS ( BudgetDates )
VAR DailyAmount =
    DIVIDE ( BudgetToDivide, NumOfDays )
RETURN
    SUMX ( VALUES ( Dim_date[Date] ), DailyAmount )
Explanation:
- We set the starting and ending points of the quarters (FirstQTRDate and LastQTRDate)
This will give us the correct start and end of quarter no matter which granularity we use. E.q. if we use yearly granularity, the quarter start will be 1/1/2019 (first day of the 1st quarter), while the quarter end will be 12/31/2019 (last day of the 4th quarter). 2. On quarter and lower granularities starting and ending points will always be the start/end date of the quarter under a given filter context. 3. BudgetDates variable - We need to determine which days are included inside our quarter borders – we will use this variable in 2 different places and with 2 different outcomes. 4. BudgetToDivide variable – We use this variable to determine the total budget that needs to be split, taken into consideration different granularities. In the CALCULATE argument part, we must use the IN syntax since the BudgetDates variable will always return a table of values. On the yearly granularity, it will return the sum of all quarters, while on quarter and lower granularities, it will always return a quarterly budget. 5. NumOfDays variable – Counts the number of days at the Target granularity (the number will never go below 90 if the granularity is drilled below a quarter, but will also return yearly number (365) in case we use yearly granularity). 6. DailyAmount variable - Splits the BudgetToDivide amounts to average daily amounts.
After we acquire the DailyAmount figure (no matter which granularity is used in the visual), we create an iteration over the date’s column, summing the DailyAmount with the respect of the current filter context.
On the yearly granularity, The formula will divide total yearly sales by 365 to get a DailyAmount, and then iterate through 365 days summing the same DailyAmounts. This way, for the higher granularities (above quarter), we will get identical figures as if we were to sum the total quarter sales.
The lower granularities (below the quarter one) is where the formula shines. On the lower granularities (EQ weekly), for a given week, we will again get a DailyAmount (this time by dividing quarterly budget with 90, check 4th step in the explanation) and then iterate through 7 days summing the DailyAmounts to get the total weekly amount. If we were to sum all the weekly figures that fall into one quarter, we will get the total quarterly target Amount.
The calculation provides an accurate and correct split of target data no matter which date hierarchy we use (Yearly, Quarterly, Monthy, Daily). It also provides accurate split in case of a non-standard split (e.q. weekly).

In case you need an accurate linear split of higher date granularities, then this could be the way to go. If you need a more detailed granularity split (e.q. by the LY historical ratios) the formula becomes a bit more complex. I will try to explain this option in the following post.
Hope you find this date granularity split technique helpful!
Feel free to comment in the comment section below!
Hello, thank you for this awesome example. How should i modify the formula, if i only need workdays? In my calendar table IsWorkday column avaible. Thank you
Hi, thanks for Your great work. I'm wondering if you could let me know how to adjust the formula to calculate only working days w/o holidays and weekends.Of course I have the working days marked in my calendar table. Thanks in advance for your help.
Hello, This was really helpfull, however I am getting an usual just in April when I try to calculate the YTD measure on this one. Any idea why and how to fix it?
Sorry for the confusing text above... I meant the YTD calculation doesn't make any sense... Where could this be coming from?
Hi George, The problem is in the logic of the calculation. The standard YTD calculation you use - CALCULATE ( [BudgetSplit], DATESYTD(Dim_date[Date]) for the month of April would do the following: Take the sum of Q1 & Q2 (311,995+107,544 = 419,539)Split the two quarters of the budget into daily amounts (419,539/181 = 2,317.90)181 is the number of days in the first six months of the yearIterate over the first 4 months (120 days) and sum up daily amounts (2,317.90*120 = 278,147 - the value you see for the month of April) So, the interpretation of YTD actually would make some sense as that is the sum of average daily amounts for the first 2 quarters for all dates between Jan 1st and April 30th (YTD). If you wish to implement a logic that sums up all the BudgetSplit values, you could implement the following calculation:
This calculation will iterate through dates, and for each date return BudgetSplit value, and finally, sum all the values depending on the granularity of the data.
Hello, thank you for your answer. I tried the formula but still getting the exact same retult at the BudgetSplit measure... Also tried a running total calculation but the problem persists..
We tested the formula and in the model we used as a demo, it is showing correct results (YTD New measure):
It does work indeed on your model. I also tried. Maybe something wrong on my code? (had to change the Datetable name...) Maybe soemthing going on with the rest of my model impacting this measure. Thanx anyway! YTD Budget Split New = VAR LatestDate = LASTDATE ( 'Date'[Date].[Date] ) RETURN SUMX ( CALCULATETABLE ( VALUES ( 'Date'[Date].[Date] ), 'Date'[Date].[Date] <= LatestDate, VALUES ( 'Date'[Date].[Date] ) ), [Budget Split] )
Thank you - but what about splitting from i.e. Brand to single item. For instance we have a measure that shows % share in 2019 for each product of a specific Brand. At the beginning of 2020 - marketing dep - comes and say we expect in 2020 X sales for Brand - can we split it into single item/product using %shares from 2019
Hi Piotr, yes of course you can, but you should use a different technique than the one mentioned in this post. The first that comes to my mind is Budget Allocation Based on Historical Data by SQLBI. Maybe give that technique a try. https://www.daxpatterns.com... In general, you should get the historical ratios of SKUs inside each brand, then apply those ratios to a new budget on brand granularity.
Odličan post. Jako lijepo napisano i objašnjeno. Pravi primjer iz prakse. Susretao sam se sa situacijama gdje je Budget na godišnjoj razini a trebalo je usporedjivati na kvartalnoj, pa su neki ljudi dodavali dodatne tri tablice koje su appendali, kako bi dobili traženo. Isto tako, zapanjuje me koliko ljudi uopće ne zna da DAX postoji , odnosno, da bi ga trebali koristiti a "koriste" Power BI. U svakom slučaju, post je lijep doprinos zajednici. Lp,Slobodan
Hvala Slobodane! Nerazumijevanje DAX-a često dovodi do nepotrebne kompleksnosti samih modela, jer se pokušava „ručno“ doći do rješenja, što često znači dodavanje nepotrebnih tablica i pisanje teških/sporih DAX kalkulacija. Drago mi je da Vam se svidio post. Lp, Krešimir