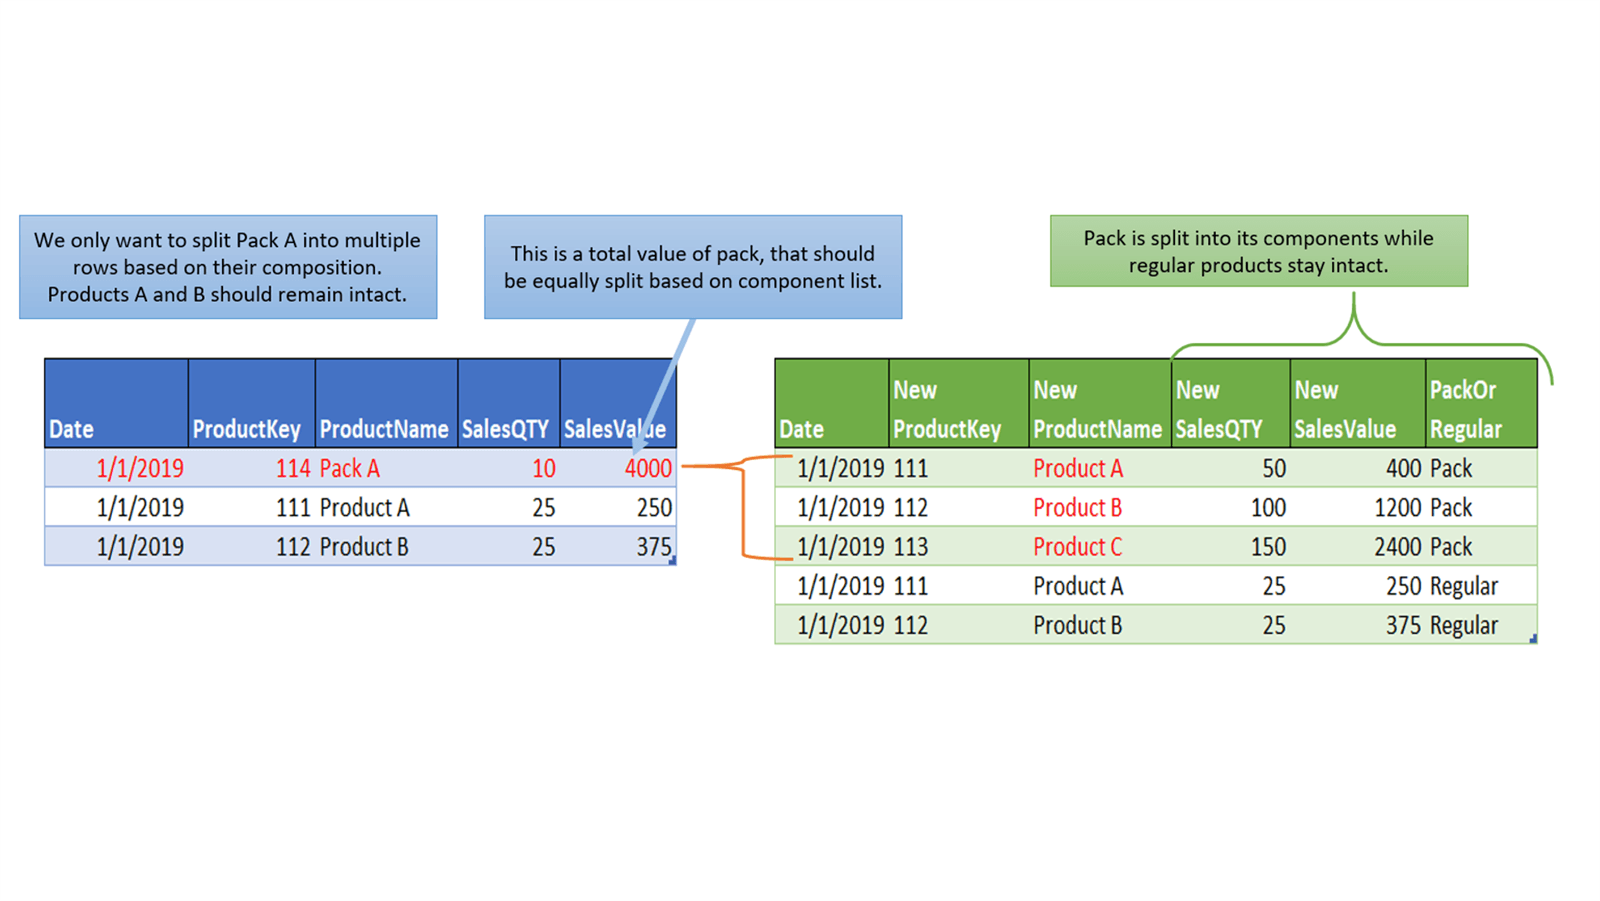
This is going to be an easy-to-follow article on how to use PowerQuery to easily change source data granularity for only a subset of data. We used a client’s request to split packs into its components as an inspiration to write this post. You can also download Excel workbook and follow along.
Sometimes in the sales data, we can have sales quantity and value of packs with multiple products included. We will show how to split those packs into individual products and how to assign correct sales values and quantities to each individual product within the pack, based on a specific key.
The problem
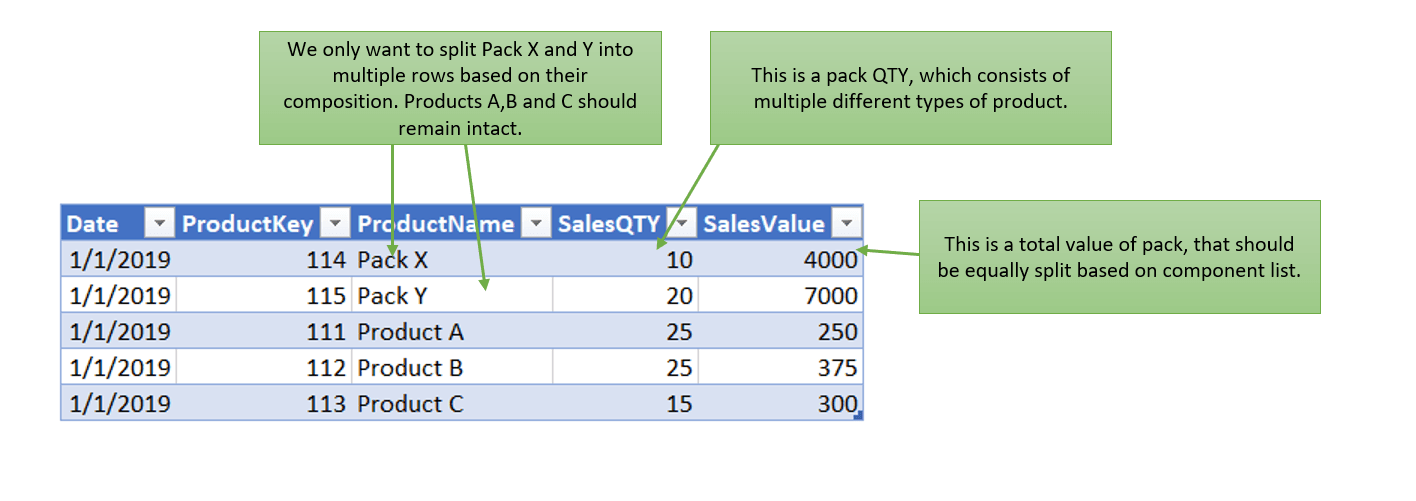
The Fact table contains multiple products, but it also contains packs of products. For example, we can have Pack X which consists of 3 products: Product A, Product B, and Product C. The quantity of each product within a pack is different. There are 5 A Products, 10 B Products, and 15 C Products. We want to remove packs from the Fact table and only show granularity on the product level. We also need a method to equally split the total value of the pack into individual product values.
We will add another pack named Pack Y, with 10 Products B and 10 Products C. Now, let’s demonstrate how to split packs using our small sample (one day, two packs).
This is our Fact table. Instead of Pack X and Pack Y, we want to have individual products, sales quantity, and sales value for each product inside the pack. At the moment, in the ProductKey column, we have mixed product and pack keys. We want to isolate PackKeys and manipulate them exclusively while leaving real products intact.
Most of the time, when dealing with packs, clients have components list where we can find which products are a part of the pack SKU. Usually, they are in a table similar to the one below.

In this table, we have pack descriptions with pack quantity (sum of individual product quantities inside of a single pack), and a description of each component of the pack with their quantities and prices.
The idea
We would want to merge those 2 tables to get individual products for each pack that is present. To do that, first, we need to get both tables inside a Power Query (queries named FactTable and PacksTable).
The first step is to merge queries by using ProductKey (from the Fact table) and PackKey (from the Components list) columns. Merge is done using the left outer join. Then, we will expand the table with columns [PackQTY], [Product], [ProductKey], and [ProductQTY]. Now, we have a table that contains two columns with product key (ProductKey and ProductKey.1) and product name (ProductName and Product).

We will use expanded columns to create a new conditional column that will populate null values of the ProductKey.1 column with the value of ProductKey. That way, we will get a new column consisting of only ProductKeys.
This techique fails if you have a null value as a standard value in ProductKey column, which is something that should not happen and if it does, it should be cleaned before this step.
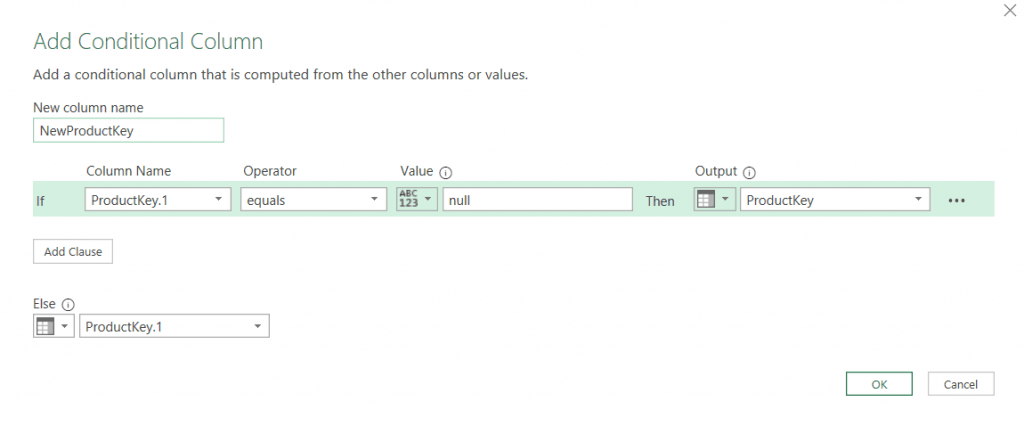
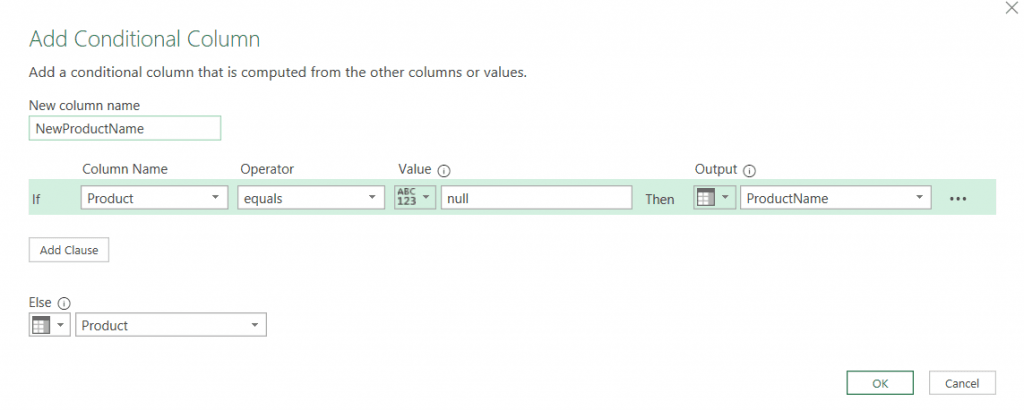
Now, we have the correct product keys and product names. To get the correct quantities, we will create a custom column in which we will multiply product quantities and sales quantities if they are packs.
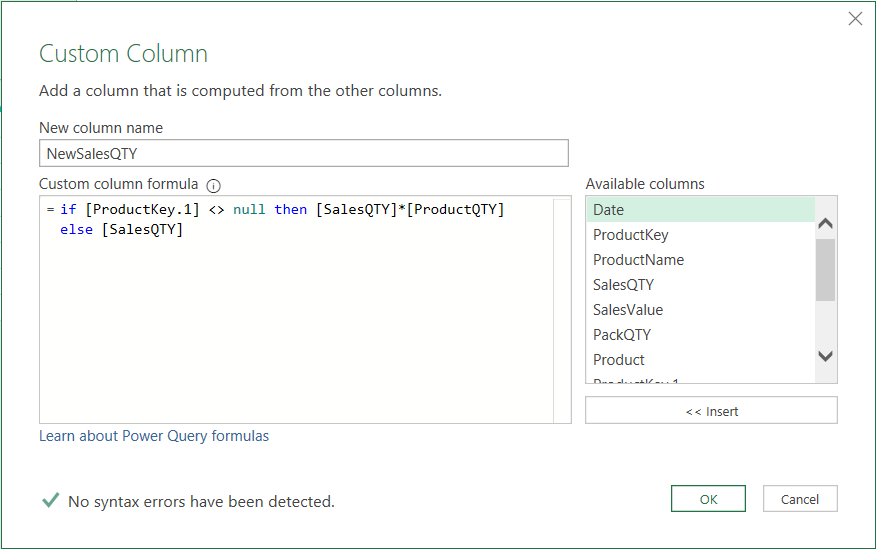
The if part checks if the product is a pack, and if it is, multiplies SalesQTY by ProductQTY. ProductKey.1 is an expanded column, so it contains nulls for all products that are not packs. After we split the sales quantity, we get this table:

Splitting the Value Column
We can see that we have the correct quantities and product keys/names. The only thing left to do is to split the SalesValue column to get the correct sales value for each product. There are multiple ways of doing it, depending on the logic you need to apply. If you have products with the same or similar price, you can simply multiply sales value by the quantity share of different products inside the pack.
For example, Pack X contains 3 products with quantities 5,10, and 15. We will divide SalesValue (4000) and PackQTY (30), then multiply by ProductQTY (5,10 or 15). This means that each product gets a value proportional to its quantity share. In our case, this would be wrong because products A, B, C in Pack A all have different prices (10,15 and 20).
This means we need to apply different logic. We want to see what is the value share (instead of quantity share) of each product in our packs. This means that we need to get individual product values (multiply columns ProductQTY and ProductPrice) and divide it by pack value (sum of all individual product values). The easiest way to get the Value share of each product is to duplicate the Pack table (Components list) and do a group by PackKey to receive totals of each pack.
let
    Source = Excel.CurrentWorkbook(){[Name="Table2"]}[Content],
    #"Added Custom" = Table.AddColumn(Source, "ProductValue", each [ProductPrice]*[ProductQTY]), //Get total value of each product
    #"Grouped Rows" = Table.Group(#"Added Custom", {"PackKey"}, {{"TotalValue", each List.Sum([ProductValue]), type number}}), //Sum values on PackKey granularity
    #"Changed Type" = Table.TransformColumnTypes(#"Grouped Rows",{{"PackKey", type text}})
in
    #"Changed Type"
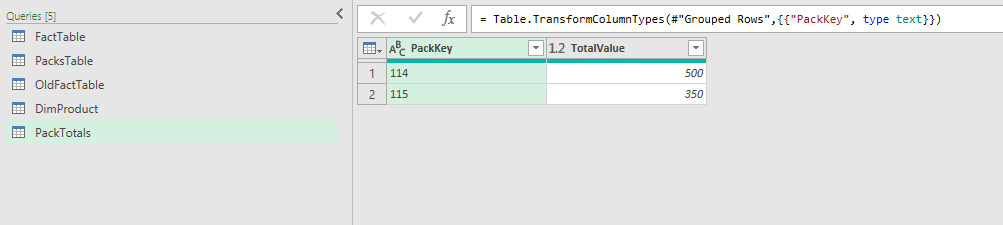
Now we can merge totals into PacksTable to create [ValueShare] column.

When we get this value share in our fact table, we can now use it to split SalesValue column into individual product sales value.
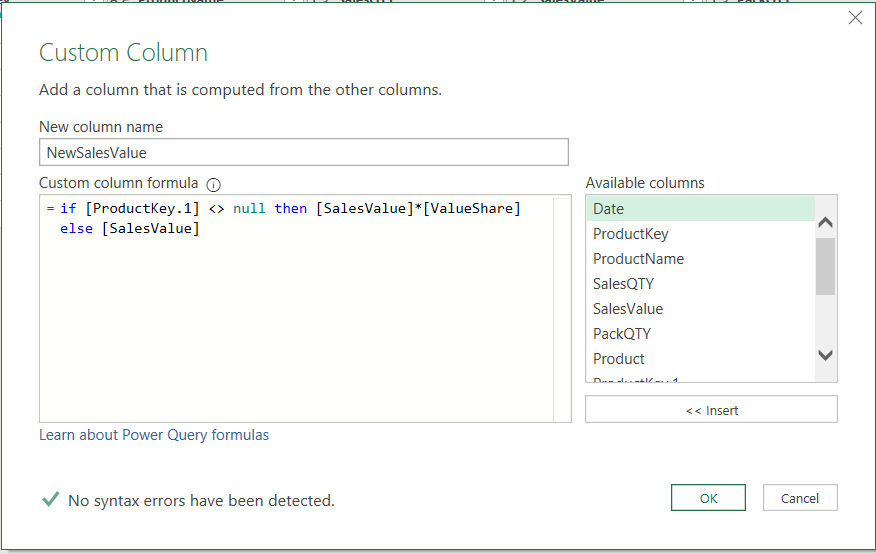
Finishing the Solution (M Code)
Finally, we have the correct sales values. It would also be good to add a column that will determine whether the product is coming from packs or is a regular product. This would be useful to compare previous quantities and values with the new ones. We will add an additional column called PackOrRegular:
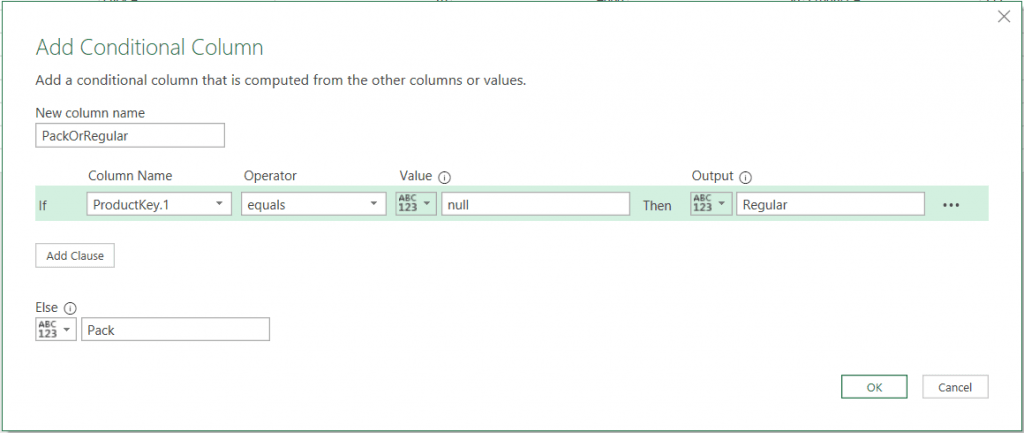
After we remove redundant columns and change column types, we get the new fact table:
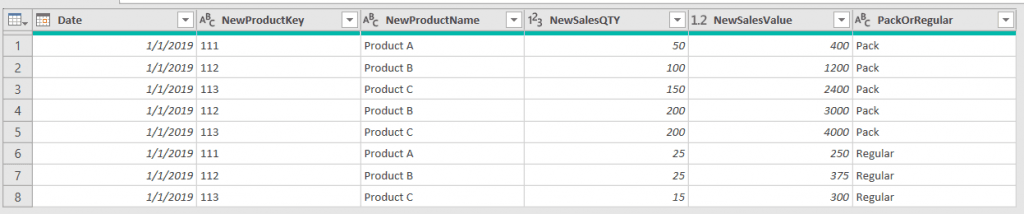
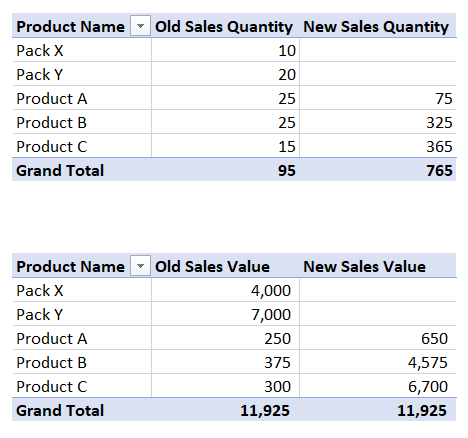
We can see that we have the correct key, name, quantity, and sales value. As you can see in the comparison below, the sum of old sales value and new sales value needs to be the same, while the new quantity needs to be greater than the old quantity (since 1 pack contains more than 1 product).
The whole M code for this solution:
let
    Source = Excel.CurrentWorkbook(){[Name="FactTable"]}[Content],
    #"Changed Type" = Table.TransformColumnTypes(Source,{{"Date", type date}, {"ProductKey", type text}, {"ProductName", type text}, {"SalesQTY", Int64.Type}, {"SalesValue", type number}}),
    #"Merged Queries" = Table.NestedJoin(#"Changed Type", {"ProductKey"}, PacksTable, {"PackKey"}, "PacksTable", JoinKind.LeftOuter),
    #"Expanded PacksTable" = Table.ExpandTableColumn(#"Merged Queries", "PacksTable", {"PackQTY", "Product", "ProductKey", "ProductQTY", "ValueShare"}, {"PackQTY", "Product", "ProductKey.1", "ProductQTY", "ValueShare"}),
    #"Added Conditional Column" = Table.AddColumn(#"Expanded PacksTable", "NewProductKey", each if [ProductKey.1] = null then [ProductKey] else [ProductKey.1]),
    #"Added Conditional Column1" = Table.AddColumn(#"Added Conditional Column", "NewProductName", each if [Product] = null then [ProductName] else [Product]),
    #"Added Custom" = Table.AddColumn(#"Added Conditional Column1", "NewSalesQTY", each if [ProductKey.1] <> null then [SalesQTY]*[ProductQTY] else [SalesQTY]),
    #"Added Custom1" = Table.AddColumn(#"Added Custom", "NewSalesValue", each if [ProductKey.1] <> null then [SalesValue]*[ValueShare] else [SalesValue]),
    #"Added Conditional Column2" = Table.AddColumn(#"Added Custom1", "PackOrRegular", each if [ProductKey.1] = null then "Regular" else "Pack"),
    #"Removed Other Columns" = Table.SelectColumns(#"Added Conditional Column2",{"Date", "NewProductKey", "NewProductName", "NewSalesQTY", "NewSalesValue","PackOrRegular"}),
    #"Changed Type1" = Table.TransformColumnTypes(#"Removed Other Columns",{{"NewProductKey", type text}, {"NewProductName", type text}, {"NewSalesQTY", Int64.Type}, {"NewSalesValue", type number}, {"PackOrRegular", type text}})
in
    #"Changed Type1"
Thank you for reading! If you have any comments, please leave them below!
Great Job!! I have a challenges with allocate incoming purchase deliveries to sales lines which has A shipment priority. Input table A Sales lines 21-123 - Prior.1 - Item A - 400 pcs Sales lines 21-103 - Prior.2 - Item A - 415 pcs Sales lines 21-023 - Prior.3 - Item A - 200 pcs Sales lines 21-125 - Prior.4 - Item A - 350 pcs Input table B (about 30K Sales lines) My incoming Purchasing orders. (Delivery from Suppliers) Item A - Week 202143 - 350 pcs Item A - Week 202144 - 375 pcs Item A - Week 202145 - 150 pcs Item A - Week 202147 - 550 pcs Output table C (Please ignore the blank rows below) Sales lines 21-123 - Prior.1 - Item A - 400 pcs - Shipment 350 pcs - week 202143 Sales lines 21-123 - Prior.1 - Item A - 400 pcs - Shipment 50 pcs - week 202144 Sales lines 21-103 - Prior.2 - Item A - 415 pcs - Shipment 325 pcs - week 202144 Sales lines 21-103 - Prior.2 - Item A - 415 pcs - Shipment 85 pcs - week 202145 Sales lines 21-023 - Prior.3 - Item A - 200 pcs - Shipment 65 pcs - week 202145 Sales lines 21-023 - Prior.3 - Item A - 200 pcs - Shipment 135 pcs - week 202147 Sales lines 21-125 - Prior.4 - Item A - 350 pcs - Shipment 350 pcs - week 202147 My thoughts is about using the Power Query functions below List.generateRunning Total in grouped tables (List.Sum)List.Transform({1..[SplitLines]) but I don’t how solve the M-code Can you support on this
Nice solution. Also try reading this by Imke Feldmann: https://www.thebiccountant.com/2019/10/03/parent-child-hierarchies-with-multiple-parents-in-power-bi-with-power-query/
Thanks for sharing your knowledge Kresimir =) Although it's not mentioned in this post but in previous post, I like how you simplify the understanding of the each function through the DAX row context concept. Keep up the good work and thank you once again.
Hi Luke, thank you for your comment! Glad you find our articles useful. We put an effort into making each function easy to understand since it hides many advanced features :)