PowerBI is a combination of visualization tools (like Tableau), Self-service analysis tools (like PivotTable) and cloud-based tools. You get all this under one product which is user-friendly, easy to implement and maintain. On the other hand, it is strong enough to be used in large companies for complex data modeling and reporting requirements.

Since the introduction on July 24, 2015, PowerBI has become one of the leaders in self-service BI tools.
No wonder Gartner (American research and advisory firm, ~8000 employees) stated PowerBI as a leader for Business Intelligence and Analytics Platforms. PowerBI has a robust roadmap for future, which is emphasizing it as a good long turn investment in both large and small companies. It is estimated that currently 200.000 organizations in 205 countries are using PowerBI.

First of all, it is IT free, meaning you do not need an IT company to implement BI solution, or dedicated IT specialist solely for the purpose of extracting data. Even if you have no experience working with databases, you can still connect to them, import data and start working on insights. Many different sources can easily be imported to build robust data models.
If you are good with Excel and PivotTables, the transition to PowerPivot, which is the machine driving PowerBI, will be relatively smooth. You will still need to learn DAX to create more complex calculations and data models.

Implementing PowerBI is extremely cost-effective. PowerBI desktop version is completely free with all the features included. You can learn how to create BI solutions and even implement them in a company to some degree without even spending a dollar. This is extremely useful if you are a small&medium company transitioning to BI. As soon as you need to transition from free to paid options, the cost is still ridiculously small (only $10 per user per month), which is significantly smaller considering other BI solutions on market.

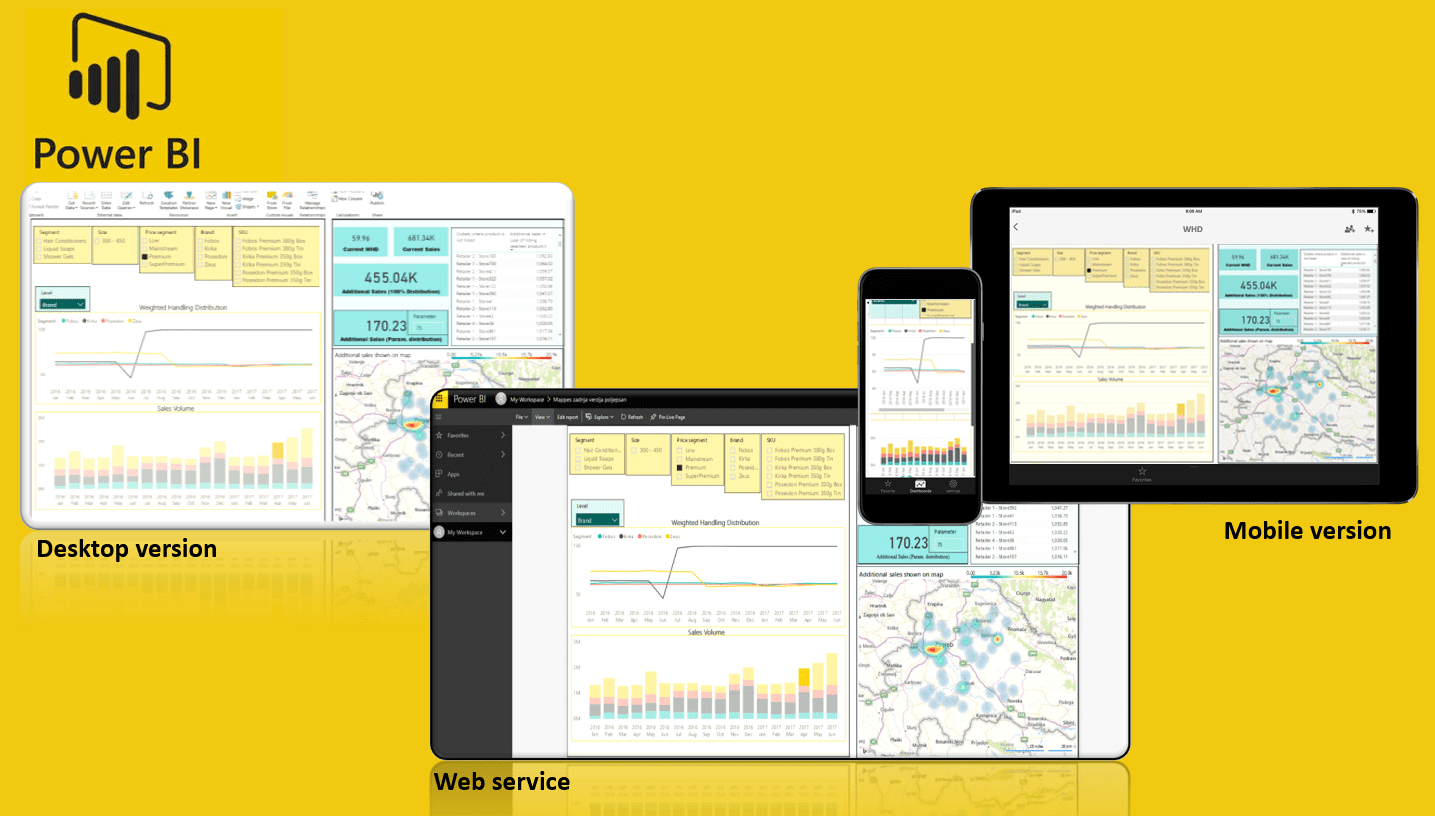
PowerBI is easy to share with colleagues. Once you created a report using the PowerBI desktop version and uploaded it to PowerBI web service, you can share it with your colleagues. They can access reports using a computer, tablet or mobile device. This way you always stay in touch with data, no matter where you are (as long as you have an internet connection).

The main components of Power BI:
- PowerQuery
- PowerPivot
- PowerBI Desktop
- PowerBI Web service
- PowerBI Mobile apps
As you can see, strongest features (PowerQuery and PowerPivot) are same as they are in Excel and work in synergy with other 3 components, which I will briefly describe in next section.
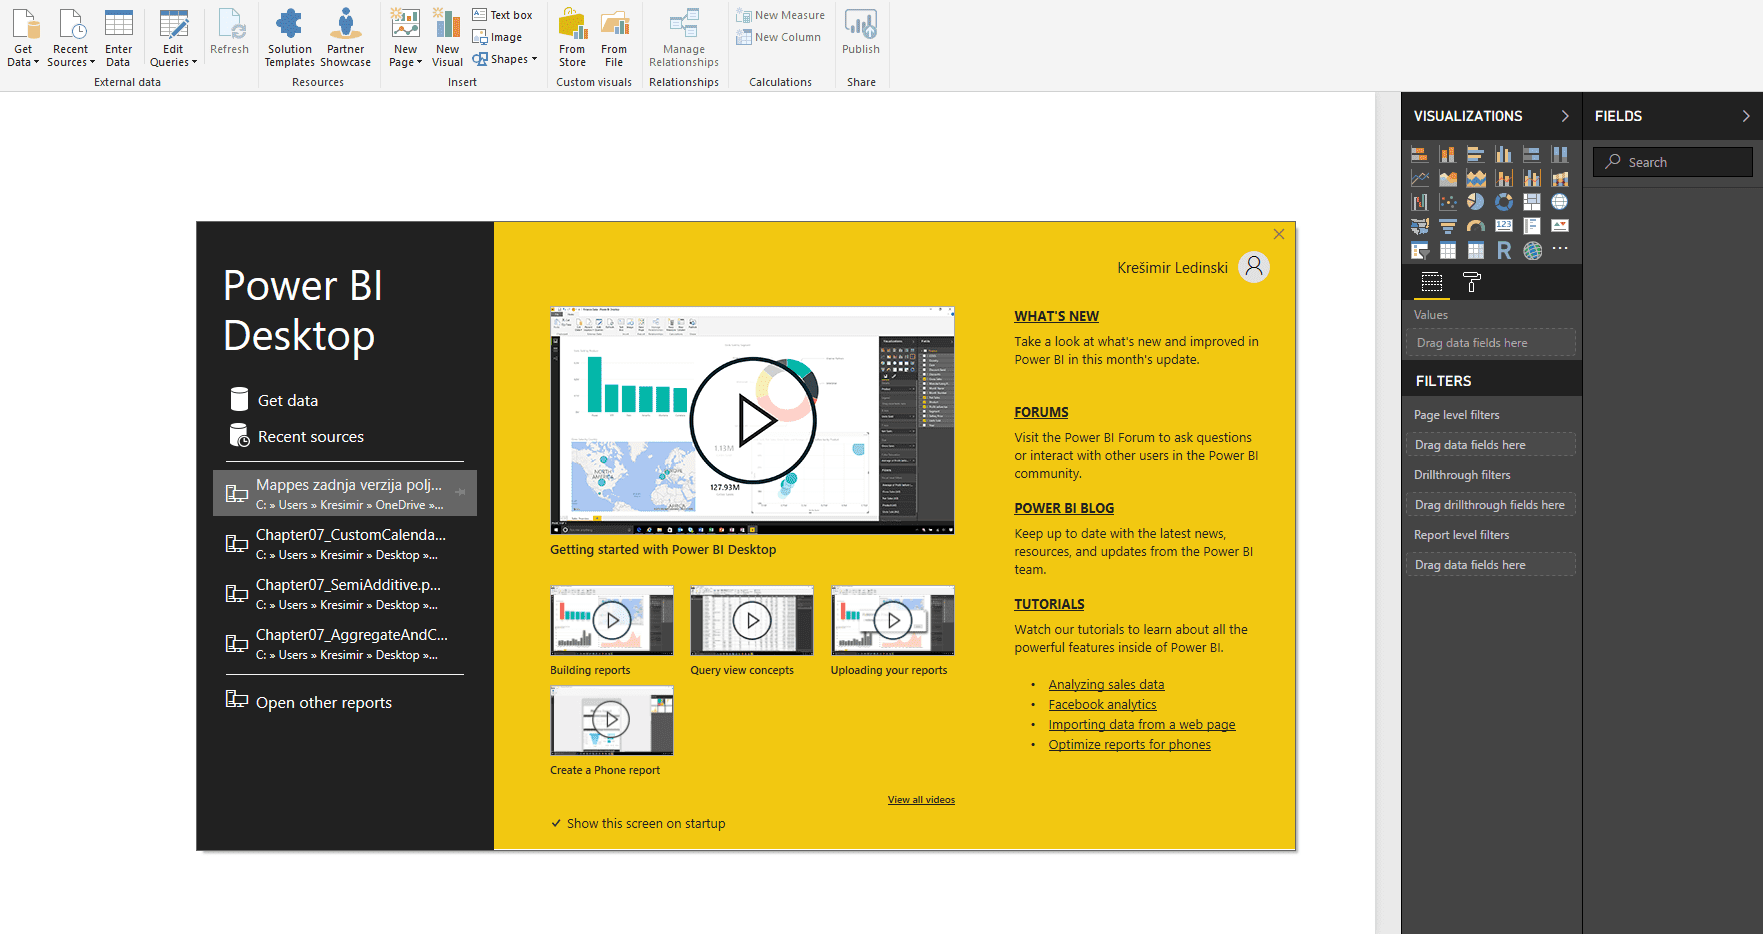
PowerBI desktop is preferable the easiest way to start your journey with PowerBI. In Desktop version you can create a complex data model using relationships, measures and calculated columns. After the model is finished and reports are created, you can upload them to service so other employees can consume them. PowerBI desktop consist of report, data and relationship views.

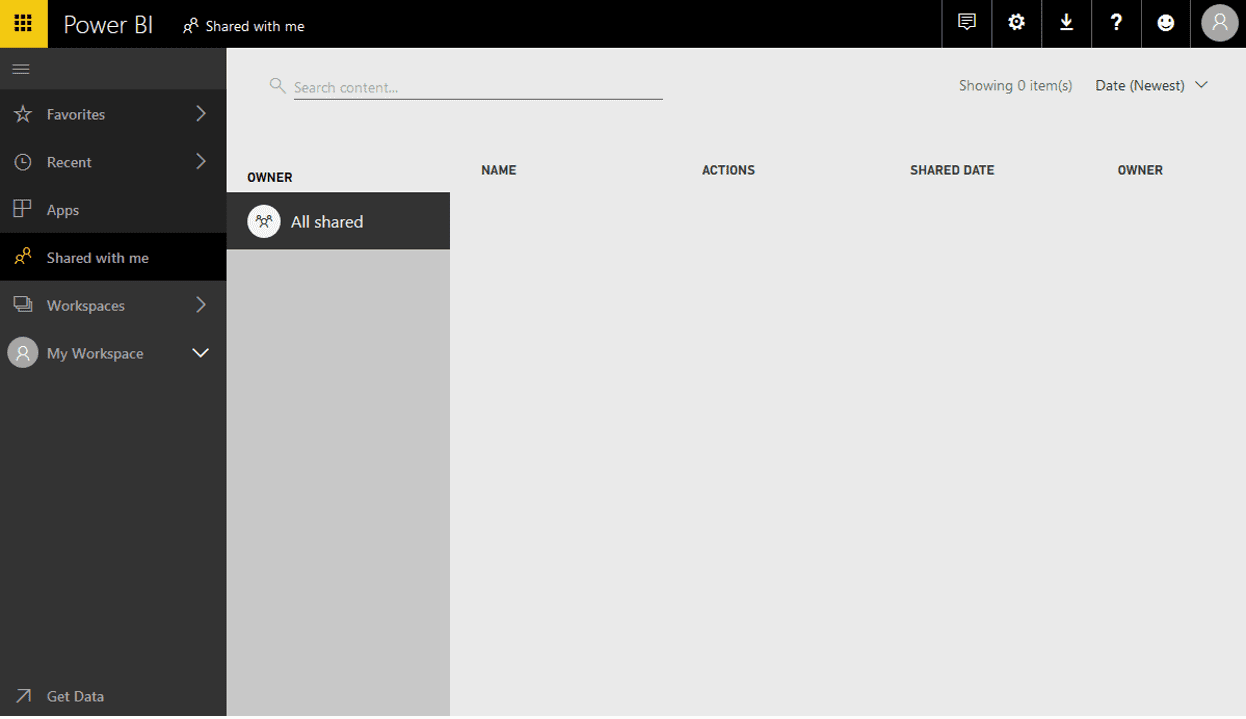
Web service is more oriented towards sharing your reports and creating dashboards combining different reports. In case you will not be dealing with data modeling, but will consume reports and dashboards created by others, you will spend lot of time in the Web service.

Use PowerBI desktop to create data models, set automatic refreshes through on-premises gateways and create visuals. Use Web Service to create dashboards, use content packs, and share reports.
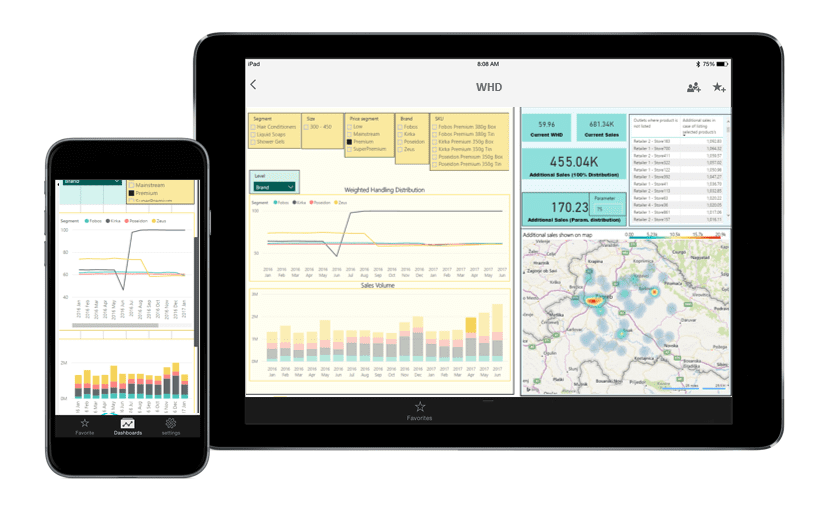
PowerBI mobile is an extension that allows users to connect to PowerBI service through Android, iOS or Windows Phone platform, and consume dashboards adjusted to the screen size of their mobile devices.

Conclusion:
PowerBI Offers modern, new approach to BI. Its possibility to connect to numerous data sources, fast query executions, easy sharing and maintaining, and simple but effective approach to data modeling is ensuring him an edge over the competition in the following years. Its affordable price will be one of the key elements of strong penetration in every company which is transforming to BI approach. The world is transforming to big data, yet is looking for simple solutions to manage the ever-evolving world of numbers. PowerBI has the capabilities to become simple yet extremely powerful solution which will transform every employee into a data specialist.
If you have any questions, please comment below.
If you liked this article, don’t forget to Share/Like!


