


Introduction
CALCULATE/CALCULATETABLE are the most important functions in DAX, and the only ones that are capable of modifying the original filter context. CALCULATE has a few rules you need to follow, and they aren’t that hard to understand. The complexity comes when those rules interfere with each other or with the original filter context.
Original Filter Context
Original filter context is made from all the filters that are influencing the Measure at a certain point in a visual before the Measure starts with its evaluation. These filters can be either direct ones (plotted on the same visual), or cross-filtered through the interaction between 2 or more visuals.
Note: It is extremely important to understand the following example thoroughly. Without the comprehensive understanding of the way original filter context is being created it will be impossible to comprehend filter context modifications or row 2 filter context transition.
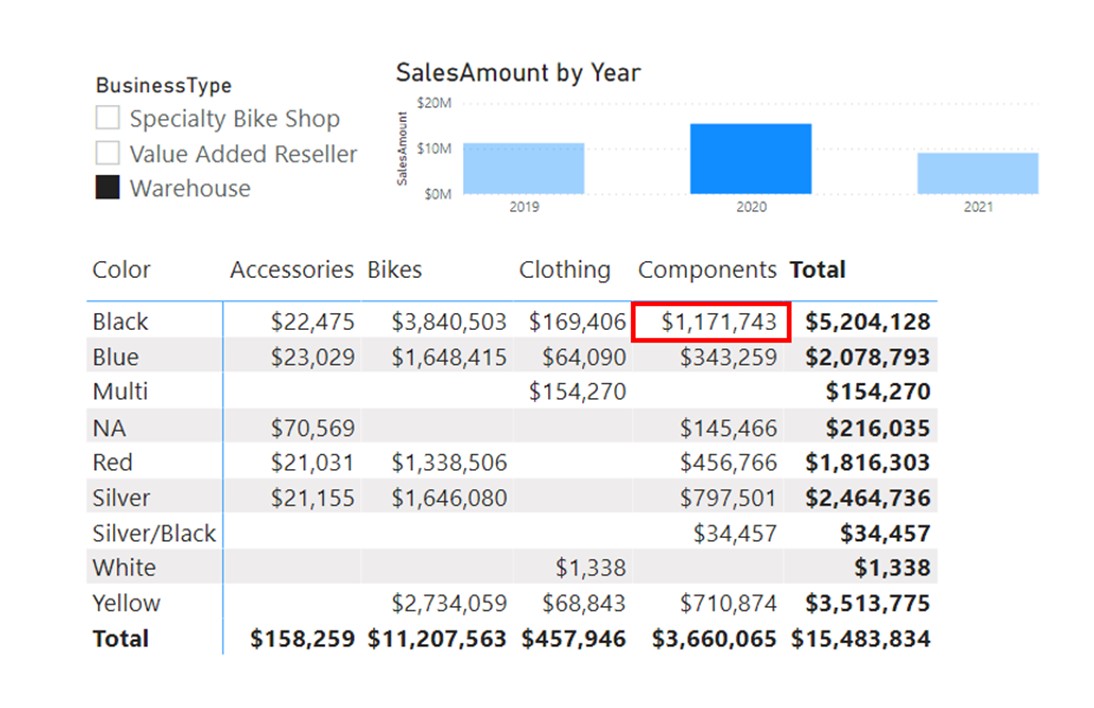
When debugging a Measure, always pick a specific cell (or point) in a visual, then check which filters are being applied to the selected cell. Those filters can be direct or indirect. If we focus on the cell with a red border, we can conclude the following.
There are 2 direct filters impacting this cell. Those are:
- DimProduct[Color]=”Black”
- DimProduct[CategoryName]=”Components”
Besides direct filters, there are also 2 filters that cross filter this visual, and they are coming from other visuals on the canvas. Those are:
- DimCustomer[BusinessType]=”Warehouse”
- DimDate[Year] =”2020”
For that selected cell in the visual, there are 4 filters applied to the cell before the calculation even starts. The calculation [SalesAmount] has the following formula:
SalesAmount = SUMX(FactSales,FactSales[UnitPrice]*FactSales[OrderQuantity])
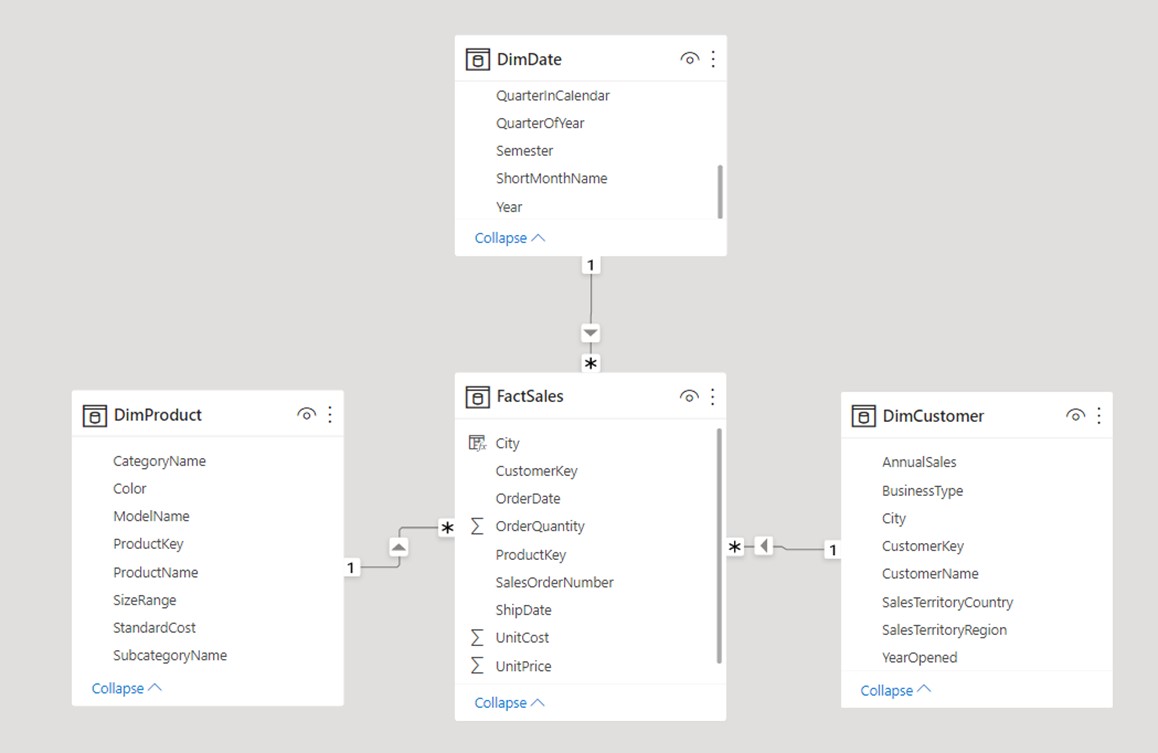
If we observe the data model, we can see that the measure is using only columns from the FactSales table. But we can also see that all the dimension tables have a 1-* relationship with the FactTable, meaning filters applied to their columns also flow to the FactSales table and filter it before the calculation starts. This is the reason why, even though the calculation is the same for every cell in the visual, it returns different values for different cells. This is all the result of the different filters applied to cells that are forming the original filter context under which the calculation is being evaluated.
Why do you need CALCULATE?
Once you plot measures in a visual, they always fall under the influence of the original filter context. This is extremely useful since you don’t have to worry about changing the calculation for every possible combination of fields plotted on the visual. but this also poses a big issue in case you need to break free of a certain original context filter (e.g. if you wish to always show the grand total values for every field). Or if you wish to change the original filter context so that you could do a comparison between different filters. For those mentioned, and many more purposes, you need a way of modifying or ignoring the original filter context. This is where the CALCULATE/CALCULATETABLE function shine.
Because DAX is all about filtering the data model, every logic you wish to write with DAX has to include some kind of filter manipulation. This is what is meant by “Thinking in DAX terms”. This is the hardest part of DAX to grasp, and since it almost always includes filter context manipulation, it also makes CALCULATE the hardest DAX function to master. But if you pay attention to its basic concepts and order of evaluation, you will have a much easier time understanding and using it correctly in your measures.


