


Iterative Table Functions Overview
In our previous article, we saw that grouping table functions have one main purpose. That is to group values from columns supplied as arguments into a single table on the granularity defined by the group-by operation.
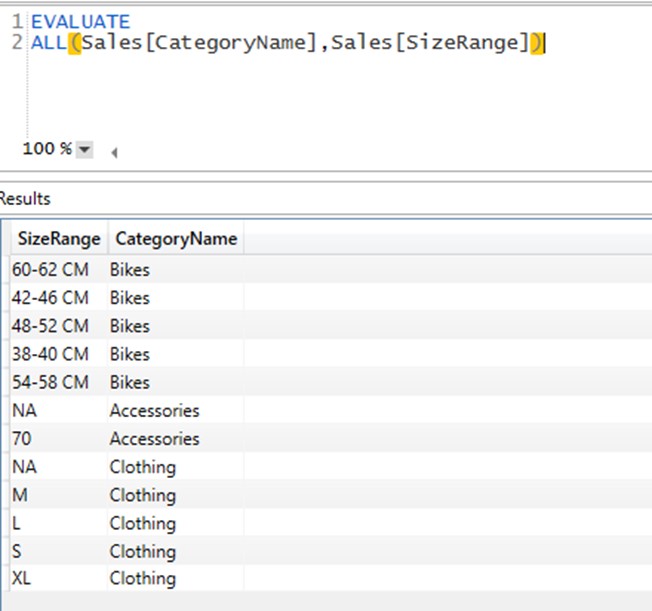
We refer to Group-by as the table created upon grouping columns from the source table on the higher granularity. In the picture below we created a table on the granularity of SizeRange-Category name. We can now use that table to iterate upon it or use it to modify DAX calculation.
Iterative functions are different in the way that they accept a table or result of a table function as the first argument, then iterate over it creating a row context in which additional row-by-row logic is supplied.
If you do not know what row context is, please refer to this article.
We will explain this topic with FILTER and ADDCOLUMNS, which are one of the most used iterative functions in DAX.
FILTER
FILTER is used to remove rows from a supplied table that do not survive the condition created in a row-by-row iteration. It accepts the original filter context coming from visual (or modified filter context in the moment of FILTER function evaluation, as it will be explained in CALCULATE chapter).
The syntax for the function is FILTER(Table, row-by-row condition).
We will use the following 4 calculations to explain FILTER function in detail.
[# Of Transactions] = COUNTROWS(Sales)
[# of Transactions Germany] = COUNTROWS(FILTER(Sales,Sales[SalesTerritoryRegion]="Germany"))
[TotalQTY] = SUM(Sales[QTY])
[QTY only products over 200$] = SUMX(FILTER(Sales,Sales[Price]>200),Sales[QTY])

Again, to be able to correctly interpret values in a visual, we need to focus only on a single point. We will debug figures with the original filter context Sales[Color]=”Yellow”. The first measure [# Of Transactions] simply counts the rows of the Sales table filtered with the original filter context. The situation becomes more interesting with the second measure. Let’s check in DAX Studio the tables each of these measures return.
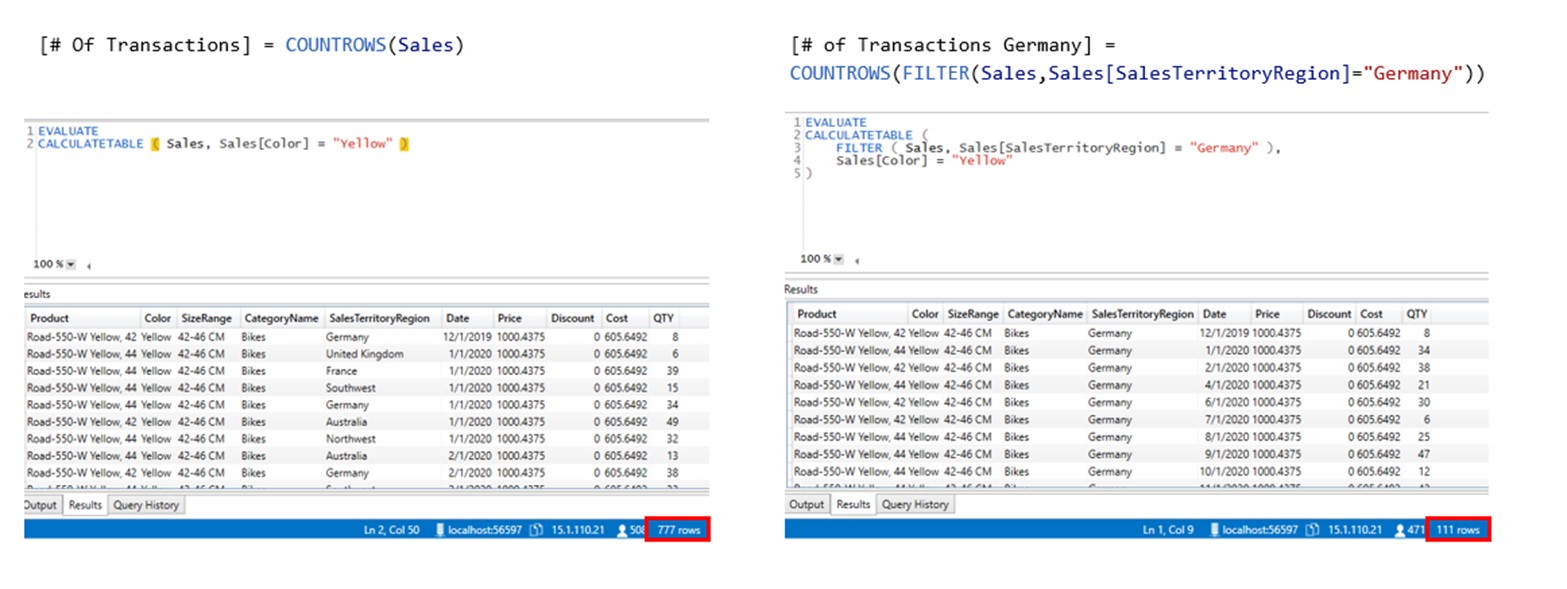
The measure to the left counts the rows of the table solely under the condition coming from the original filter context. The measure to the right counts the rows of the table with original filter context applied + additional filter coming from the FILTER function argument. FILTER function returns table object with fewer rows, the ones that survived the filtering condition (Sales[SalesTerritoryRegion]=”Germany”).
FILTER Used in Iterative Functions
The result of the FILTER function can be used with any other function which accepts a table as an argument, such as SUMX, as for the calculation:
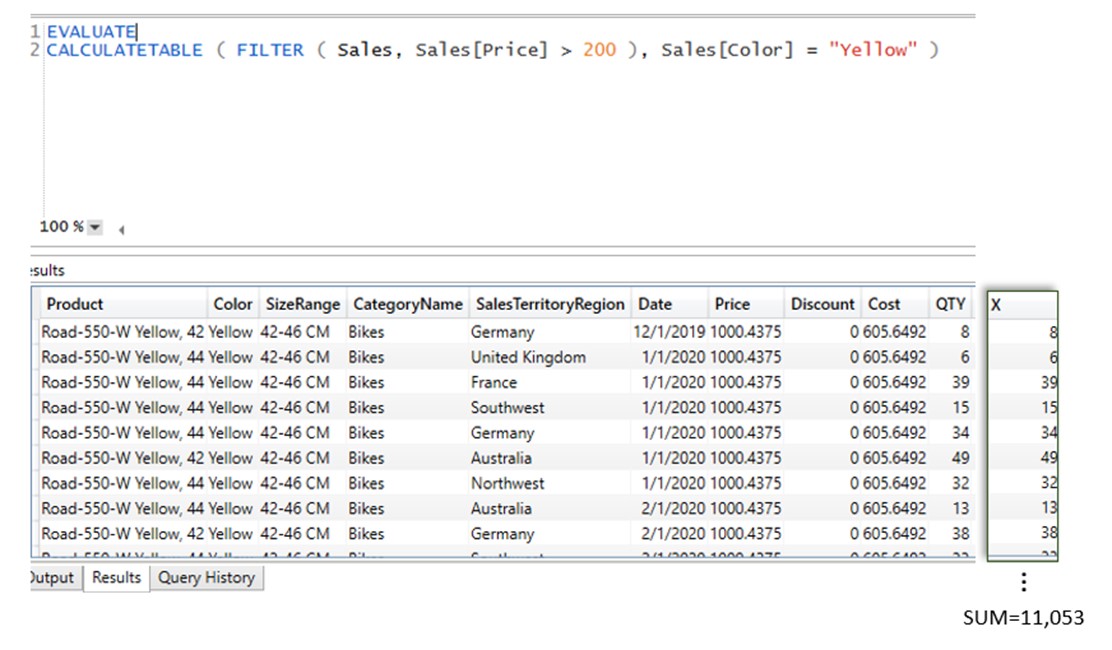
[QTY only products over 200$] =SUMX(FILTER(Sales, Sales[Price] > 200), Sales[QTY])
SUMX is an iterative function, which accepts the result of a FILTER function as its first argument. In FILTER function the original Sales table is filtered with the criteria Sales[Price]>200. SUMX adds a virtual “X” column to the FILTER table result in which it calculates X formula in a row context. Since X formula is a simple reference to the column Sales[QTY], the values of the virtual “X” columns are the same as the total QTY one. After all X values are calculated in row-by-row manner, the SUM part of the function sums all values in “X” column. The result is then returned to the corresponding point in a visual.
FILTER does not change the structure or granularity of the table supplied in the first argument, but only removes rows which does not apply to a condition added as the second argument.
FILTER Conditions
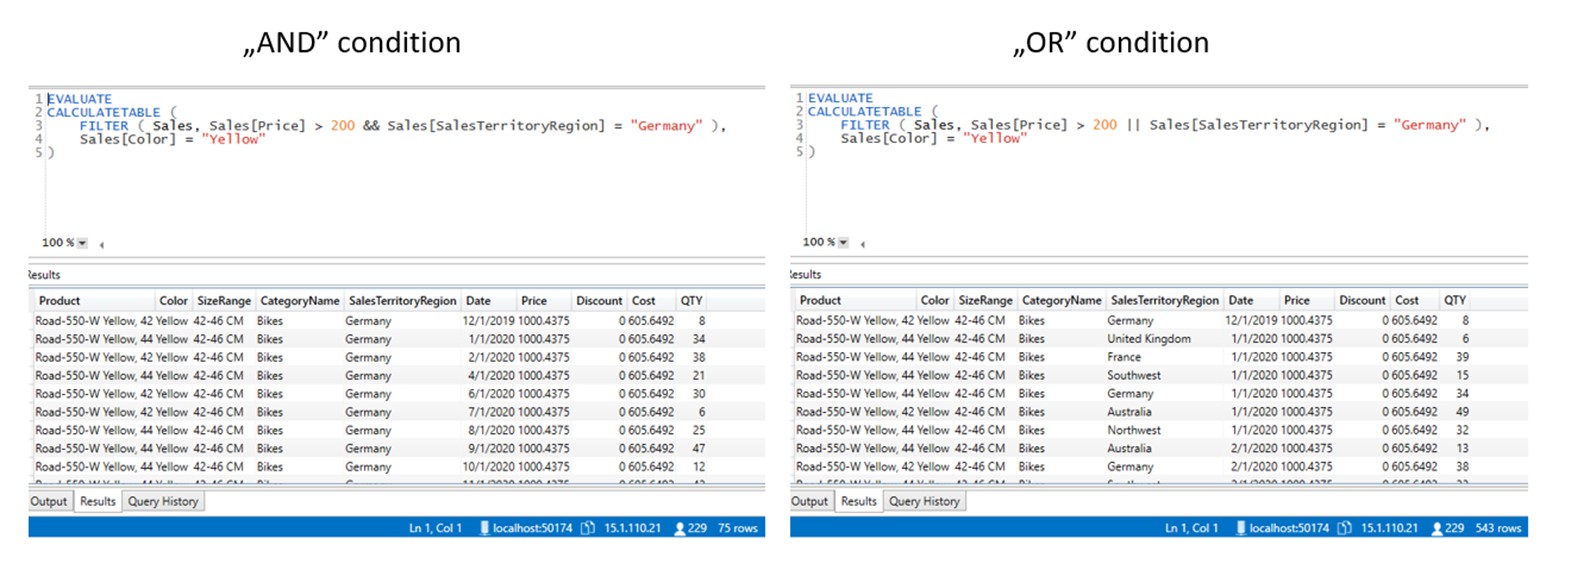
FILTER argument can use simple rules, or more advanced ones, such as or/and arguments.
You can even nest calculations which result is used to form a condition. This is an advanced topic covered in later chapters.
FILTER can operate only on the columns supplied in the table argument. If we create a crossjoin
of columns Sales[Color] and Sales[SalesTerritoryRegion] with ALL function, then filter argument can only use those 2 columns to further filter the table.
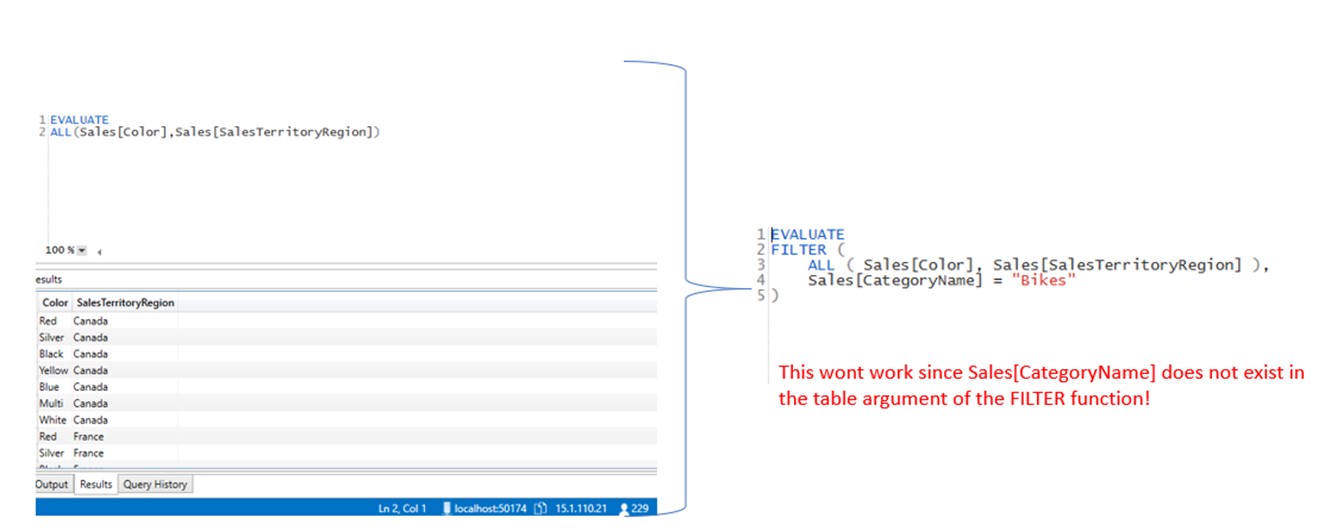
All columns used in the condition argument of the FILTER function need also to be in its table argument! If you need to add condition with a column not being a part of the FILTER first argument, then you need to modify the context using CALCULATETABLE function.
ADDCOLUMNS
Syntax: ADDCOLUMNS(Table, [ColumnName1], expression, [ColumnName2], expression,…)
ADDCOLUMNS function is used to add additional virtual columns to the table supplied as the first argument.
We can show the result of ADDCOLUMNS with DAX Studio.
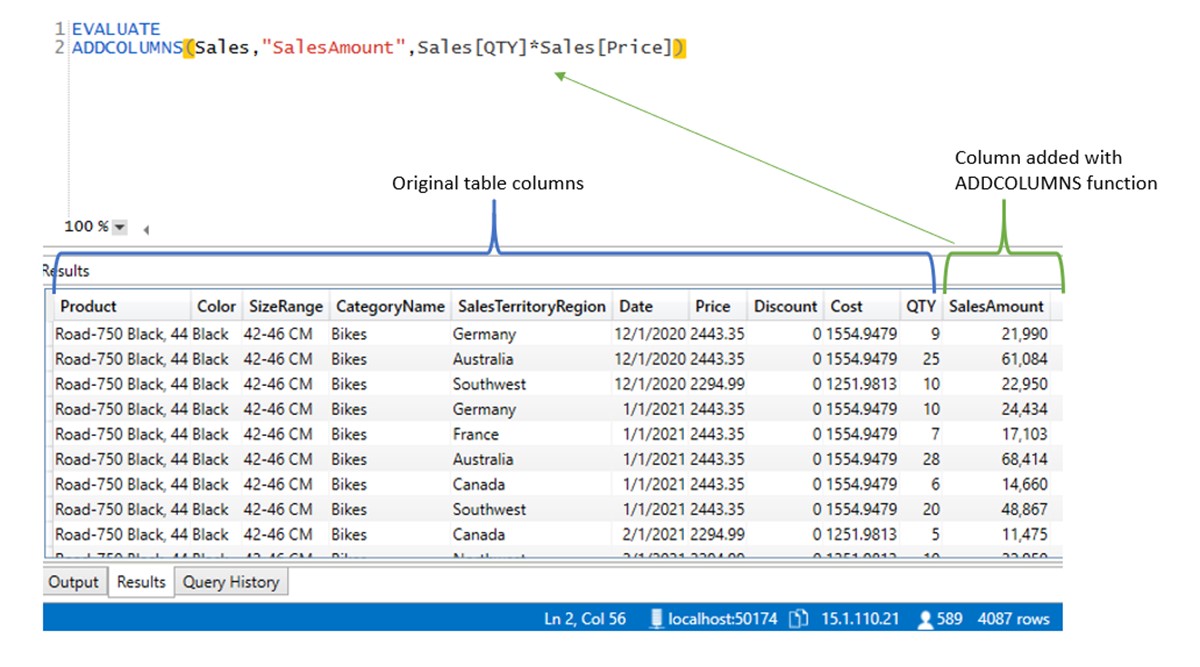
ADDCOLUMNS is especially powerful when used with row 2 filter context transformation, which will be covered in the CALCULATE chapter. At the moment, it’s important to understand that ADDCOLUMNS is an iterative table function you will use in advanced DAX modeling.


