DAX HANDBOOK
4.3 Mixed functions

If you wish to follow along, you can find PBIX/Excel files at the bottom of the article. 

Authors

Krešimir Ledinski

Krešimir Ledinski

Microsoft certified expert in the field of Business Intelligence. His biggest passions are DAX, M, and data modeling.

Kristian Radoš

Kristian Radoš

Experienced data analyst. Advanced in SQL, PowerApps and M language.

Explanation

Mixed functions are the ones that can form group-by of multiple columns and define different data granularities while having the ability to invoke row context over the newly formed tables. The most important one is SUMMARIZE.

SUMMARIZE is mostly used as a replacement for VALUES function when we need to create crossjoin of multiple columns from the model while accepting filter context. VALUES function can only accept a single column or the whole table as an argument, but if we need to form a table from multiple columns then SUMMARIZE is the preferred way to go.

SUMMARIZE syntax:

SUMMARIZE (Table, [GroupByColumn1, GroupByColumn2, …], [[ColName1], expression, [ColName2], expression, …])

  • The first argument is the table from which we wish to group columns.
  • The second type of argument is a list of columns we wish to include in a grouped virtual table.
  • The third type of argument is defining the new column we want to add to the virtual table with the expression that will be evaluated in a row context of the summarized table. The 3rd argument is rarely used. If we need to add an additional virtual column to the SUMMARIZE function, we should use ADDCOLUMNS function instead because, in most cases, the latter produces a faster query plan.
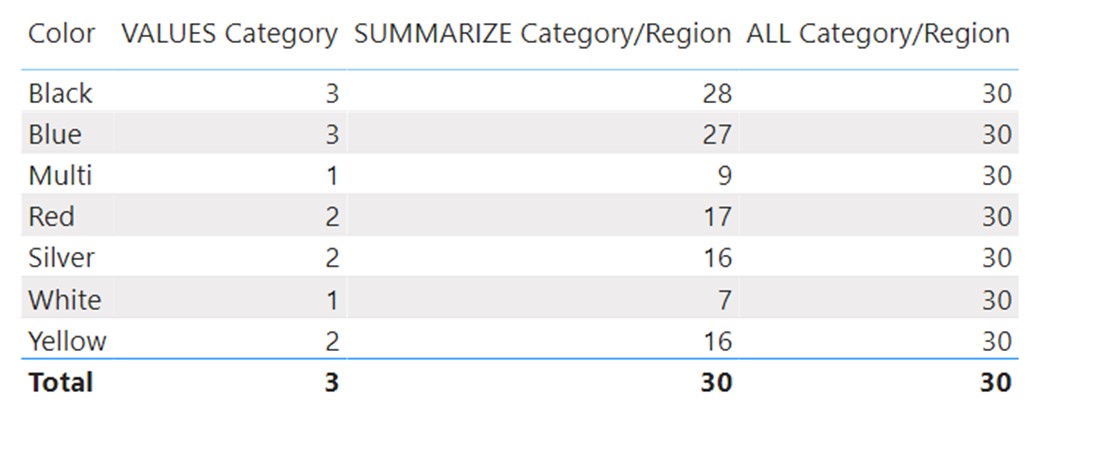
VALUES_Category = COUNTROWS(VALUES(Sales[CategoryName]))

VALUES can only accept a single column or a whole table as an argument, which limits its application. It accepts filter context.

ALL_Category/Region = COUNTROWS(ALL(Sales[CategoryName],Sales[SalesTerritoryRegion]))

ALL function can be used with multiple columns, but its side effect is that it ignores filter context

SUMMARIZE_Category/Region = COUNTROWS(SUMMARIZE(Sales,Sales[CategoryName],Sales[SalesTerritoryRegion]))

SUMMARIZE is the best replacement for the VALUES function when we need to cross-join multiple columns. It does that while accepting filter context.

SUMMARIZE notes:
Like with the ADDCOLUMNS function, its usefulness becomes clear after learning the power of the CALCULATE function.


SUMMARIZE can access any table in a data model connected to the table defined in the first argument, as long as that table has a one to many relationship with the main table. The data model concept will be explained in the following chapter.

Materials

We wish to create the best possible content!

If you are a novice looking for a better explanation of any element of the topic, feel free to comment on the part you didn't quite understand!

If you are an expert in DAX and believe certain topic lacks important internals, your comments are more than welcomed!

COMMENTS

Subscribe
Notify of
guest
0 Comments
Inline Feedbacks
View all comments

OUR SERVICES

Prefer live training or consultations?

Table of Content

Table of Content

GET LATEST BI NEWS TO YOUR INBOX

Receive the latest updates on all business analyst news across all platforms.

By subscribing you are agreeing to our Privacy Policy.

Related blog posts

Advanced Excel training for client Hilding Anders

We have started our autumn training sessions! We are starting with a dear client from Međimurje, Hilding Anders, where we’ll deliver an advanced Excel training for the logistics and production departments. The training will last a total of 16 hours, split into 2-hour sessions. Advanced Excel is useful for all...

Read more

Napredna Excel edukacija za klijenta Hilding Anders

Krenuli smo s jesenskim edukacijama! Edukacije započinjemo kod dragog klijenta iz Međimurja, Hilding Anders, gdje ćemo za odjele logistike i proizvodnje proći kroz naprednu Excel edukaciju. Edukacija će trajati sveukupno 16 sati u terminima po 2 sata. Napredni Excel koristan je svim polaznicima koji svakodnevno rade sa velikom količinom podataka,...

Read more

Business improvement with the help of Power BI

How did we improve our client’s business with the help of Power BI? A global brand with a branch in the Adriatic region had several problems: • Uncollected receivables• Sales without margin (price lists in disarray)• Hidden losses• Unprofitable product lines and stockpiling• Lack of focus in sales and procurement,...

Read more

Unaprijeđenje poslovanja pomoću Power BI-ja

Kako smo uz pomoć Power BI-ja unaprijedili poslovanje našeg klijenta? Globalni brand s podružnicom u Adriatic regiji je imao više problema: Nenaplaćena potraživanja Prodaja bez marže (cjenici u rasulu) Skriveni gubici Neprofitne linije proizvoda i gomilanje zaliha Nije bilo fokusa u prodaji i nabavi već se sve obavljalo stihijski Zašto...

Read more
0
Would love your thoughts, please comment.x
()
x
Scroll to Top